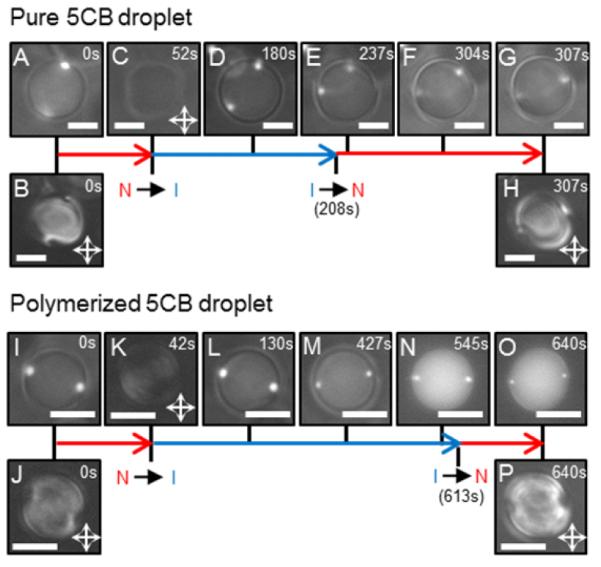
Figure 3.

(A, D-G; I, L-O) Combined Fluo and BF images of LC droplets during their heating into the isotropic (I) phase and cooling into the nematic (N) phase. (B, C, H, J, K, and P) PL micrographs; B, H, J, and P are PL micrographs corresponding to A, G, I, and O, respectively. (A-H) Pure and (I-P) polymerized 5CB droplets, with a diameter of 9.4 μm and 6.7 μm, respectively, which initially exhibit two diametrically opposite 1-μm-diameter PS colloids located at their poles in the N phase. Scale bars: 5 μm. (M-O) The intensity of the fluorescent spots decreases over time; this decrease stems from diffusion and dissolution of the fluorescent dye contained in the PS colloids into 5CB.
