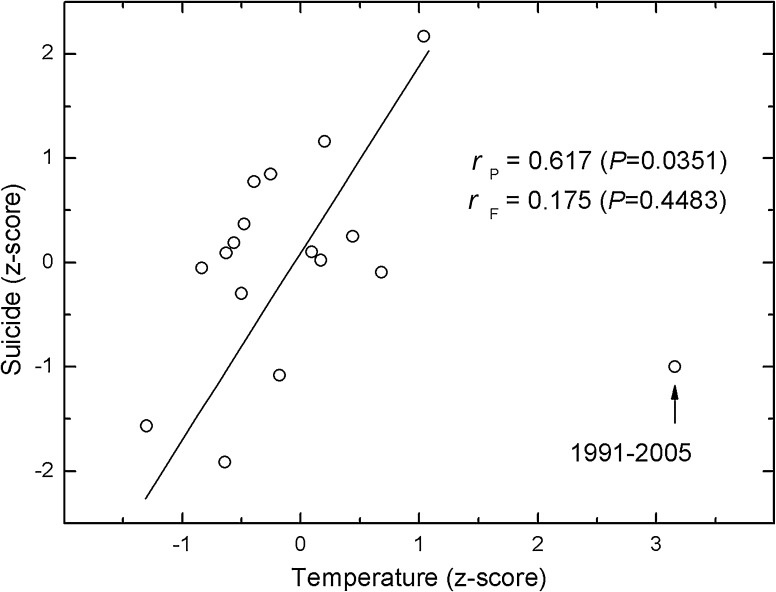
Fig. 2.
Sensitivity of suicidal deaths to temperature fluctuations. Linear model quantifies the pre-program association using 15-year means of suicide rates and temperatures. Pearson correlations are shown both for the pre-program (rP) (here, 1751–1990) and full (rF) (here, 1751–2005) periods, with Monte Carlo [27] based statistical significance (P). Z-score refers to the number of standard deviations from the long-term mean of the series

