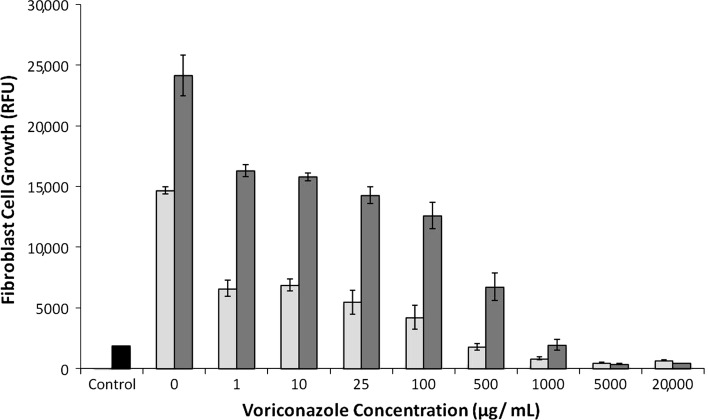
Fig. 5.
A graph plots fibroblast cell growth versus initial voriconazole concentration after removal of voriconazole. Cell growth is quantified by RFU at 7 days (light gray bars) and 11 days (dark gray bars). In cells initially exposed to 1 to 500 μg/mL, growth and morphology recovered. Control (black bar) is the RFU for the 5000 cells initially seeded in each well. Data are shown as mean ± SD, for n = 4 wells/concentration.

