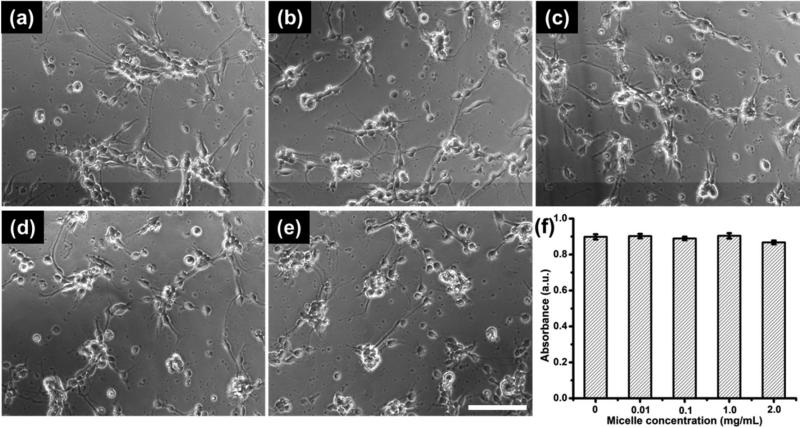
Figure 4.
Phase contrast images show morphology of cortical neurons following 24 h treatment with (a) 0 mg/mL, (b) 0.01 mg/mL, (c) 0.10 mg/mL, (d) 1.0 mg/mL, and (e) 2.0 mg/mL micelles respectively. Scale bar = 100 μm. (f) Neural cytotoxicity of the micelles was also quantified using WST-1 assay. The data shown (f) are average ± STD (n = 3).

