
Figure 3.
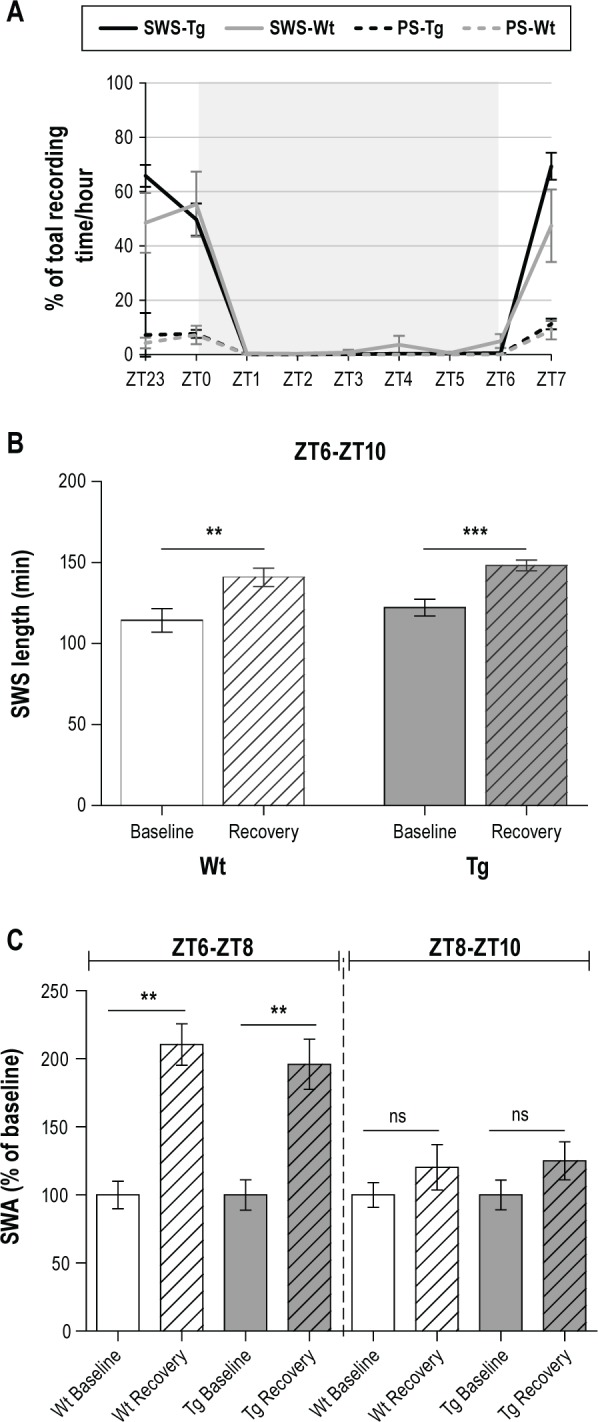
(A) Hourly SWS and PS duration during 6-h sleep deprivation achieved with the CaResS device in young adult Wt and Tg mice. Sleep durations are expressed as percentages of 60-min recordings. The gray shaded area shows the CaResS activation period (6 h). Values are the mean ± SEM, n = 6 for Wt group and n = 8 for Tg group. (B) Total length of SWS in minutes from ZT6 to ZT10 in baseline conditions and after 6-h TSD (beginning at ZT0) in young adult Wt mice (n = 8, white and white shaded bars) and Tg mice (n = 8, gray and gray shaded bars). Rebound in each group was statistically significant (**P < 0.01, ***P < 0.001). (C) Slow wave activity (SWA) of SWS following 6-h TSD expressed as percentages of the baseline conditions from ZT6 to ZT8 (left part of the panel) and from ZT8 to ZT10 (right part of the panel) in young adult Wt mice (n = 5, white and white shaded bars) and Tg mice (n = 6, gray and gray shaded bars). Data are expressed as the mean ± SEM. Rebound in each group was statistically significant from ZT6 to ZT8 (**P < 0.01) but not from ZT8 to ZT10 (ns: not statistically significant).