
Figure 5.
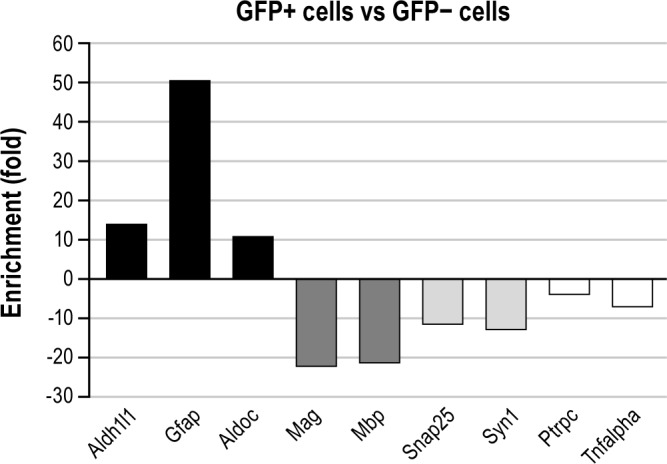
Enrichment of different cell-type markers expressed as fold changes in GFP-positive versus GFP-negative cells. Upward bars represent genes expressed at higher levels in the GFP-positive cells compared to the GFP-negative cell population. Downward bars correspond to genes with higher expression levels in the GFP-negative cell fraction compared to the GFP-positive cell population. Black, dark gray, light gray, and white bars represent astrocytic, oligodendrocytic, neuronal, and microglial markers, respectively. Aldh1l1, aldehyde dehydrogenase 1 family, member L1; Aldoc, aldolase C; Gfap, glial fibrillary acidic protein; Mag, myelin associated glycoprotein; Mbp, myelin basic protein, Ptrpc, protein tyrosine phosphatase, receptor type C; Snap25, synaptosomal-associated protein 25; Syn1, synapsin I; Tnfalpha; tumor necrosis factor alpha.