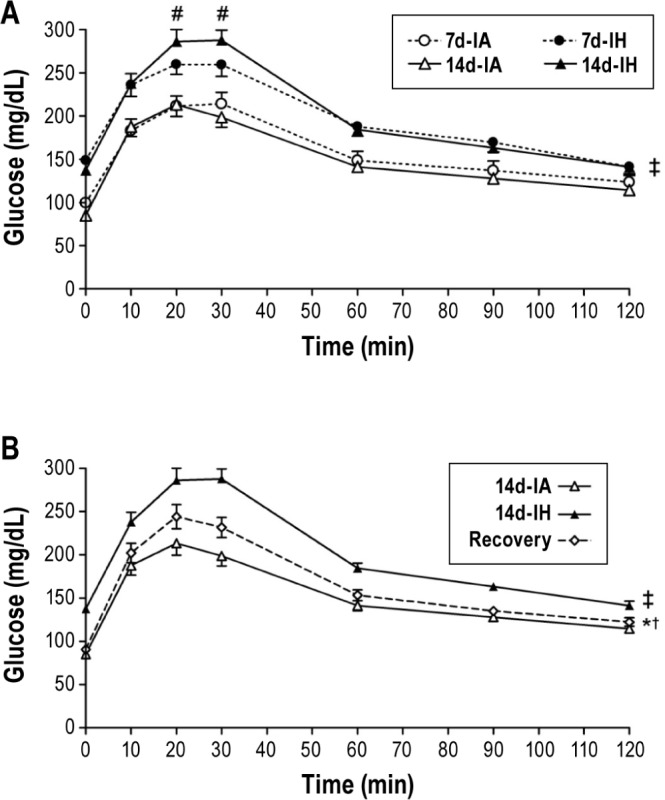
Figure 1.

(A) Intraperitoneal glucose tolerance tests (GTT) after 7 and 14 days of intermittent hypoxia (7d-IH and 14d-IH) and intermittent air (7d-IA and 14d-IA, control conditions). Data were analyzed using an analysis of variance (ANOVA) of the GTT profiles assessing the interaction between exposure group (7d-IH or 14d-IH versus control) and time during the GTT. The GTT profile of the 7d-IH group is shifted upward relative to the 7d-IA group due to differences in fasting glucose levels. However, no significant interaction between exposure group and time was observed. ‡P < 0.001 for differences between 14d-IH and 14d-IA groups, #P = 0.048 for differences between 7d-IH and 14d-IH groups. (B) GTT profiles of 14d-IA, 14d-IH and recovery groups. Data were analyzed using an ANOVA of the GTT profiles investigating the interaction between exposure groups (14d-IA, 14d-IH, and recovery) and time of GTT. ‡P < 0.05 for differences between 14d-IH and 14d-IA groups, †P = 0.001 for differences between 14d-IA and recovery groups, *P < 0.013 for differences between 14d-IH and recovery groups.
