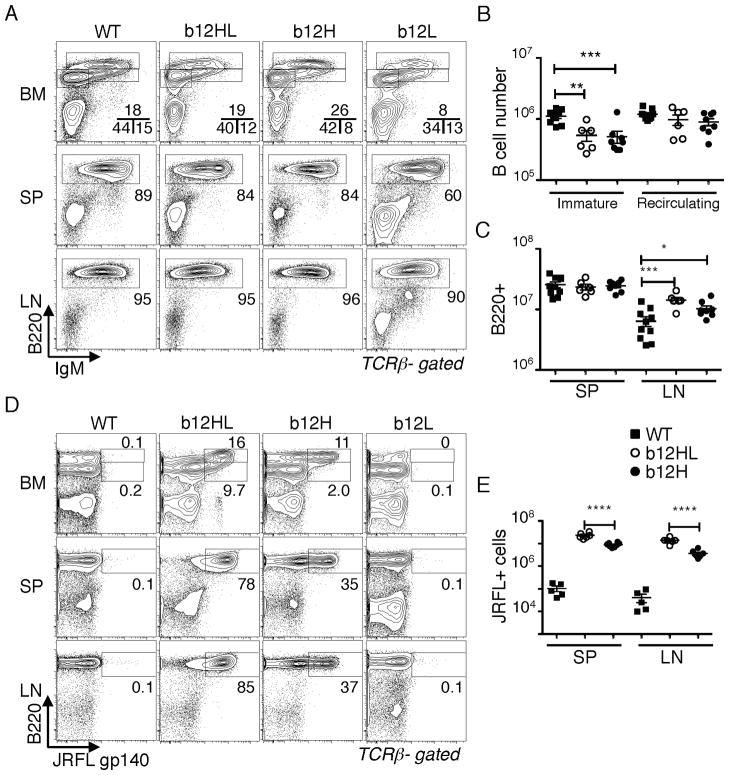
Figure 2. B cell generation and Env binding by b12 knock-in B cells.
A–C, Comparison of B cell generation in bone marrow (BM), spleen (SP) and lymph nodes (LN) of b12HL, b12H, and b12L mice. A, Flow cytometry analysis of IgM and B220 staining in BM, SP, and LN of the indicated strains. Plots shown were gated on TCRβ negative lymphocytes. Top panels indicate with boxes B220intIgM− immature B cells, B220intIgM+ immature B cells, and B220hi recirculating B cells, respectively. Middle and bottom panels box B220+ B cells. B, Statistical analysis of BM immature vs recirculating B cell numbers from wild type (WT), b12HL and b12H mice. *, p< 0.05; **, p< 0.005; ***, p< 0.0005. C, Analysis of B220+ cell numbers in SP and LN of 9 WT, 6 b12HL and 8 b12H mice. D,E, Binding of soluble Env (JRFL gp140 trimer) by B cells from the indicated strains and tissues. Each data point in E gives the value obtained from an individual mouse.

