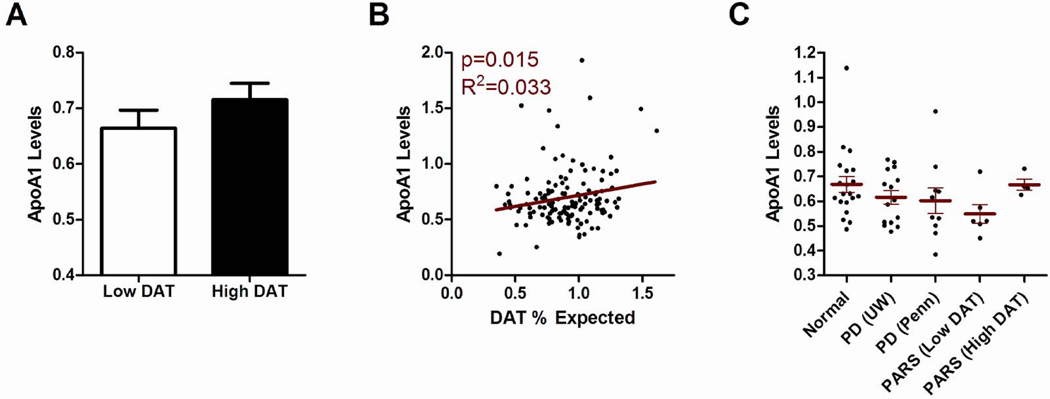
Figure 3. High plasma ApoA1 levels predict greater putaminal dopaminergic system integrity.
(A) Plasma ApoA1 levels in mg/mL (y axis) are shown for both abnormal putaminal DAT uptake (Low DAT = DAT uptake ≤80% expected for age) and normal putaminal DAT uptake (High DAT = DAT uptake >80% expected for age) groups. (B) Plasma ApoA1 levels in mg/mL are shown on the y axis; percent putaminal DAT uptake relative to age-matched healthy controls is shown on the x axis. Correlation between plasma ApoA1 levels and degree of putaminal DAT uptake was significant (p=0.015). Adjusting for age and gender did not affect this association (p=0.037). (C) Plasma ApoA1 levels in mg/mL (with means +/− SEM, y axis) are shown for normal individuals not at increased risk for PD (n=20), a subset of PD patients from the discovery cohort (n=10), a subset of PD patients from the replication cohort (n=15), and a subset of PARS cohort subjects (n=10). Discovery, replication, and PARS cohort subjects were age- and gender-matched to the normal control subjects, and individuals were drawn evenly from each tertile of ApoA1 values for each cohort. Normal vs. PD, p=0.098 by Mann-Whitney. Normal vs. Low DAT, p=0.036 by Mann-Whitney. Low DAT = DAT uptake ≤80% expected for age. High DAT = DAT uptake >80% expected for age.

