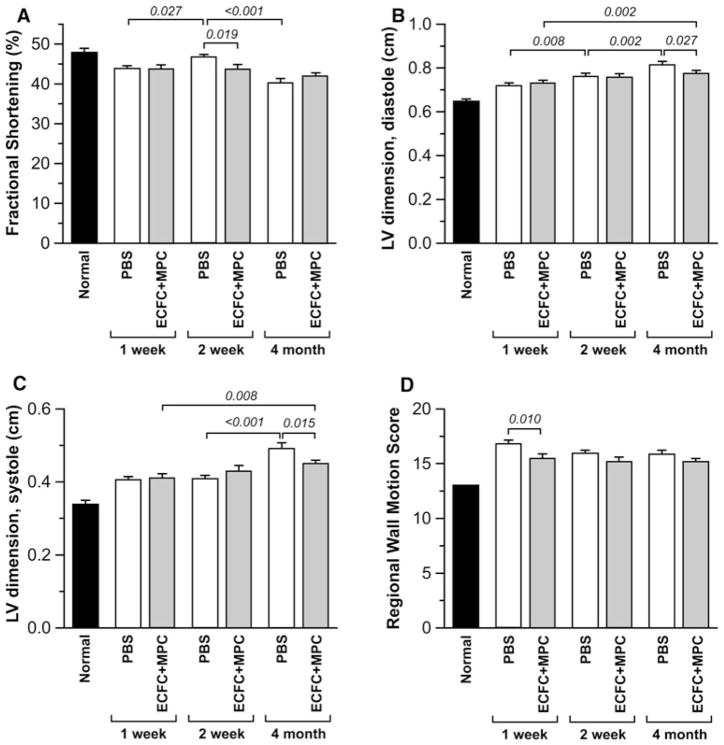
Fig. 3.
Echocardiography analysis for cardiac function. Echocardiography was performed on isoflurane-anesthetized rats at 1, 2 week, and 4 month post-IRI following PBS or ECFC + MPC injection (n = 11–17). Normal data were obtained from healthy rats (n = 2; average from repeated measurements at 3 different time points). a Fractional Shortening (FS). b LV internal dimension at end-diastole. c LV internal dimension at end-systole. d Regional WMS. Data present mean ± SEM. Numbers above bars are P values

