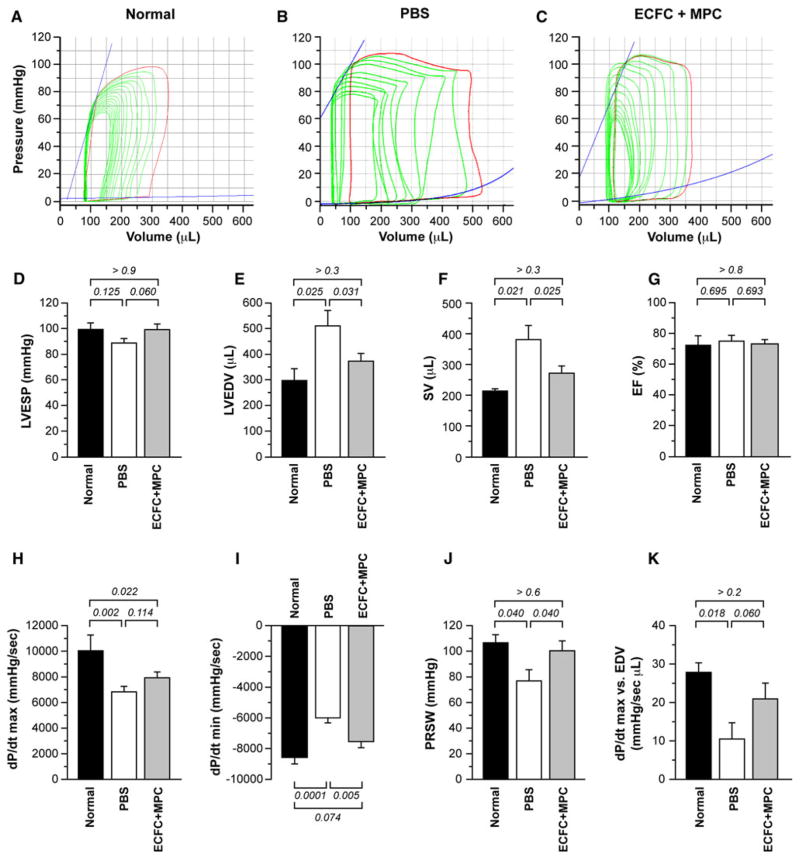
Fig. 4.
Pressure–volume (PV) loop analysis of rat hearts. PV loop measurement was performed on anesthetized rats at 5 month post-IRI with PBS or ECFC + MPC injection (n = 6–7). Normal data were obtained from healthy rats (n = 3–4). a–c Representative PV loops from normal rats, PBS-, and ECFC + MPC-injected rats at 5 month post-IRI. d LVESP. e LVEDV. f Stroke volume (SV). g Ejection fraction (EF). h Maximum rate of pressure change in the LV (dP/dt max). i Minimum rate of pressure change in the LV (dP/dt min). j Preload recruitable stroke work (PRSW). k dP/dt max versus EDV. Data present mean ± SEM. Numbers above bars are P values

