Figure 3.

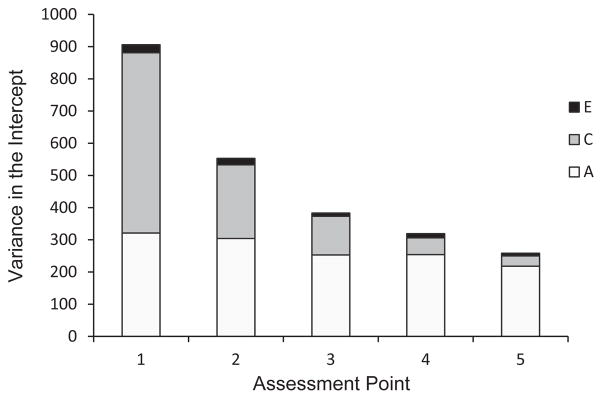
Results from recentering procedure. Bars represent genetic (A), shared environmental (C), and nonshared environmental (E) variance in the intercept when the model is centered at each of five assessment points.

Results from recentering procedure. Bars represent genetic (A), shared environmental (C), and nonshared environmental (E) variance in the intercept when the model is centered at each of five assessment points.