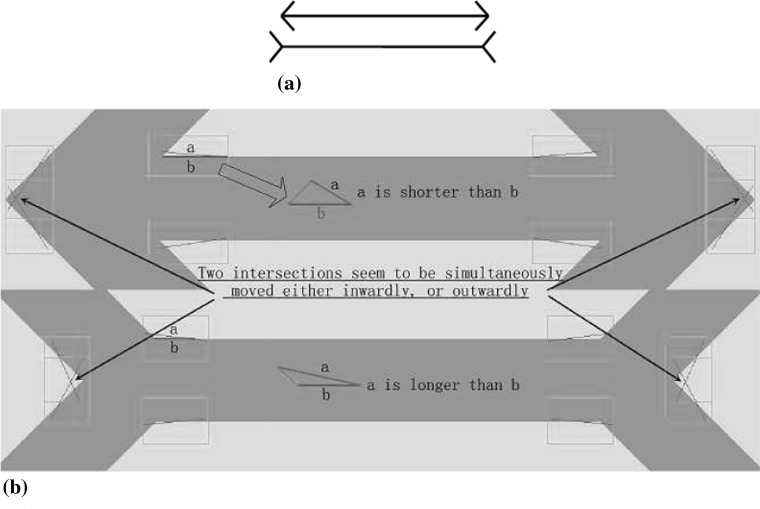
Fig. 11.
The Müller-Lyer illusion and the explanations. a The Müller-Lyer illusion. b Geometric analyses of the Müller-Lyer illusion. Two detected lines (results) are marked by a ‘a’, and the actual lines (targets) are drawn in red and marked by ‘b’. This diagram shows why the lines are perceived to be longer/shorter around the corners. The relative length of each line between the arrows is meaningless. (Color figure online)

