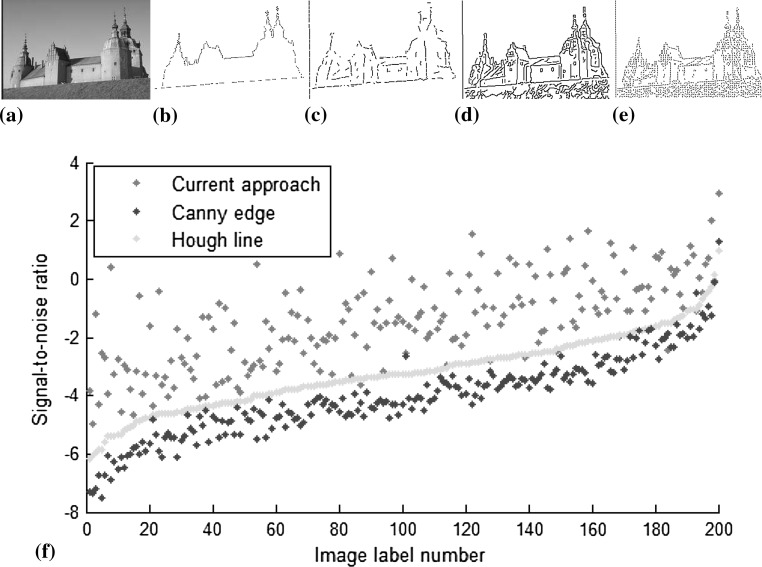
Fig. 16.
The results obtained with one image (201080.jpg) in the BSDS500-test and the statistical curves obtained with all images. a Origin. b Ground. c Current. d Canny. e Hough. f The SNR statistcal curves obtained with BSDS500. The image label numbers are adjusted to make an ascending curve of Hough transform

