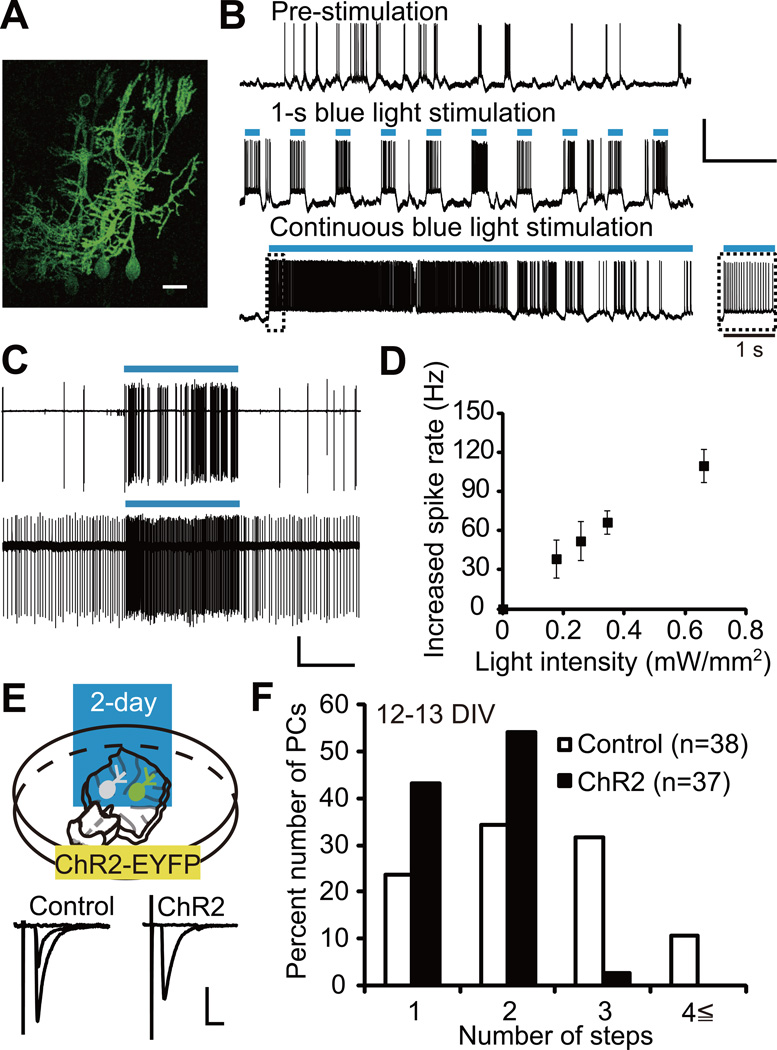
Figure 1. Two-Day Photostimulation of ChR2-Expressing PCs Accelerates CF Synapse Elimination.
(A) PCs expressing ChR2-EYFP in an olivo-cerebellar coculture. Scale bar, 20 µm.
(B) Representative voltage traces under current-clamp mode from a PC expressing ChR2. Records were taken before photostimulation (top), during 1-s photostimulation at 0.33 Hz (middle) and during continuous photostimulation (bottom). Inset, expanded trace for the first 1 s of continuous photostimulation. Durations of photostimulation are indicated by blue bars. Scale bars, 5 s and 50 mV.
(C) Cell-attached recordings from two ChR2 expressing PCs. Scale bars, 5 s and 50 pA.
(D) Increase in firing rate against blue light intensity in PCs expressing ChR2-EYFP (n = 7 PCs from 4 cocultures). The number of spikes was counted during 1 s epoch before and during photostimulation.
(E) ChR2-EYFP was expressed in PCs and blue light stimulation (1-s light exposure at 0.1 Hz) was applied for two days from 10 or 11 DIV. Representative traces of CF-EPSC recorded from a control PC (left, “control” with 2 distinct EPSC steps) and a ChR2-expressing PC (right, “ChR2” with 1 EPSC step). Scale bars, 10 ms and 1 nA. Holding potential, −30 mV. Intensity for CF stimulation in the medullary explant was increased gradually and representative single traces recorded around individual threshold intensity were superimposed. Sample CF-EPSC traces in olivo-cerebellar cocultures are shown similarly in the following figures (Figures 2A, 4A and 5A).
(F) Frequency distribution histogram for the number of CFs innervating control (open columns, n = 38 PCs) and ChR2-expressing (filled columns, n = 37 PCs) PCs from 24 cocultures. The frequency distribution was significantly different between the two groups of PCs (P = 0.0009, Mann-Whitney U test).
See also Figure S1 and Table S1.

