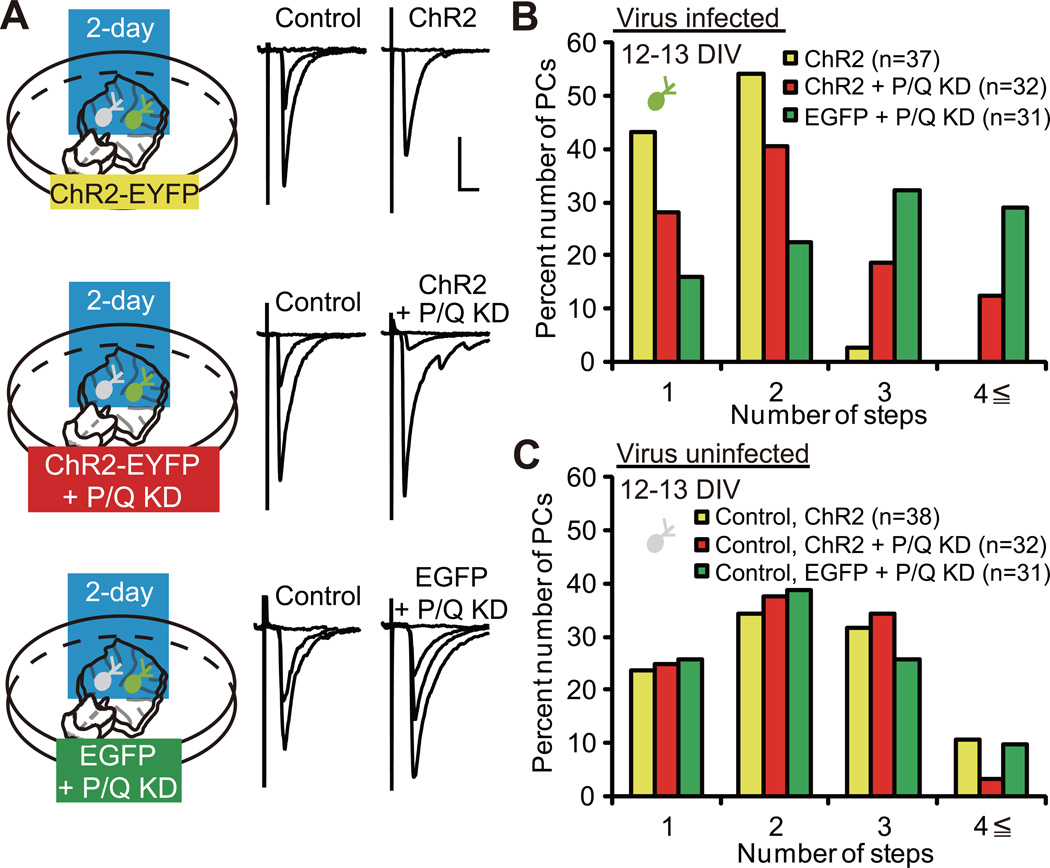
Figure 2. P/Q-Type VDCC Is Required for the Acceleration of CF Synapse Elimination.
(A) PCs with ChR2 expression (top, “ChR2”), ChR2 expression + P/Q knockdown (KD) (middle, “ChR2 + P/Q KD”) and EGFP expression + P/Q KD (bottom, “EGFP + P/Q KD”) were illuminated with blue light for two days. Representative traces of CF-EPSCs recorded at 12–13 DIV. Scale bars, 10 ms and 1 nA. Holding potential, −30 mV.
(B) Frequency distribution histogram for the number of CFs innervating PCs with ChR2 (yellow columns, n = 37 PCs from 24 cocultures), ChR2 + P/Q KD (red columns, n = 32 PCs from 22 cocultures) and EGFP + P/Q KD (green columns, n = 31 PCs from 20 cocultures). A highly significant difference was noted in CF innervation patterns among the three groups of infected PCs (P < 0.0001, Kruskal-Wallis test). Frequency distribution was significantly different between PCs with ChR2 and those with ChR2 + P/Q KD (P = 0.0412, Steel-Dwass test) and PCs with ChR2 + P/Q KD and those with EGFP + P/Q KD (P = 0.0461, Steel-Dwass test).
(C) Frequency distribution histogram for the number of CFs innervating uninfected (control) PCs (yellow columns, control for ChR2, n = 38 PCs from 24 cocultures; red columns, control for ChR2 + P/Q KD, n = 32 PCs from 22 cocultures; and green columns, control for EGFP + P/Q KD, n = 31 PCs from 20 cocultures). There was no significant difference in frequency distribution among the three groups of control PCs. P = 0.8505, Kruskal-Wallis test.
See also Figure S2.

