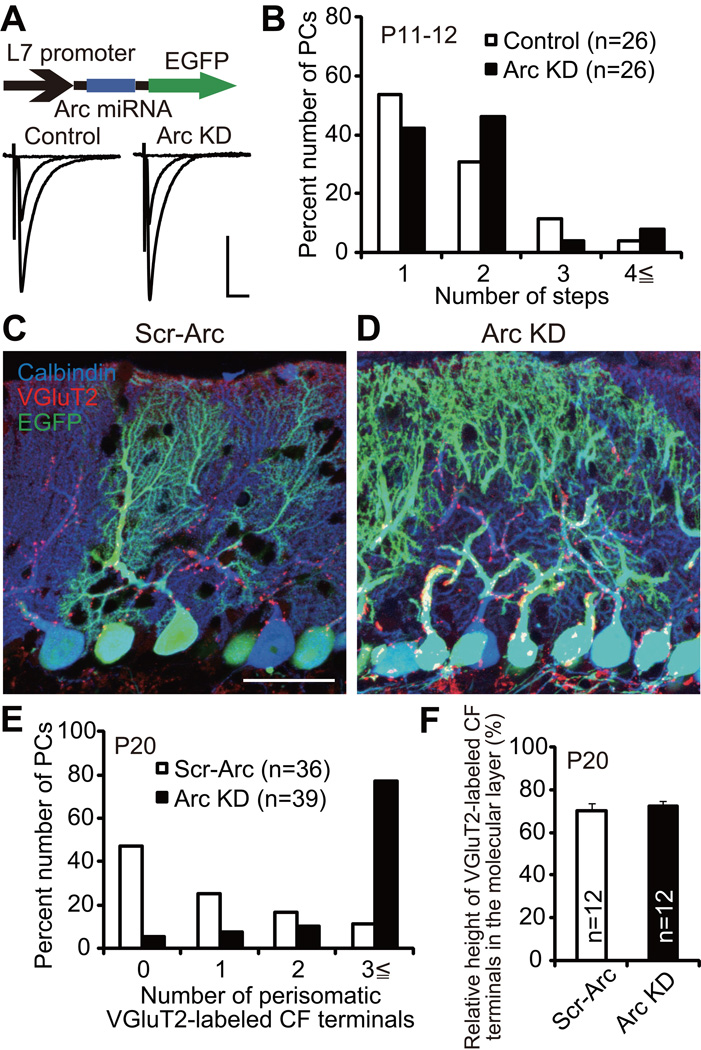
Figure 7. Persistent Perisomatic CF Innervations in Arc Knockdown PCs In Vivo.
(A) Representative traces of CF-EPSCs from a control PC (left) and a PC with Arc KD (right). Lentivirus carrying Arc miRNA and EGFP was injected at P2–3, and CF-EPSCs were recorded at P11–12 from 5 mice. Scale bars, 10 ms and 1 nA. Holding potential, −10 mV.
(B) Frequency distribution histogram for the number of CFs innervating control PCs (open columns, n = 26 PCs) and PCs with Arc KD (filled columns, n = 26 PCs) at P11–12 from 5 mice. There was no significant difference between the two groups of PCs (P = 0.5538, Mann-Whitney U test).
(C and D) Confocal microscopic images of a cerebellum transfected with scrambled control Arc miRNA (“Scr-Arc”, C) and that with Arc KD (D) showing immunoreactivities for calbindin (blue, PCs), VGluT2 (red, CF terminals) and EGFP (green). Scale bar, 50 µm.
(E) Frequency distribution histogram for the number of perisomatic CF-terminals on PCs with Scr-Arc (open columns, n = 36 PCs from 2 mice) and those with Arc KD (filled columns, n = 39 PCs from 2 mice). A highly significant difference was noted between the two groups of PCs (P < 0.0001, Mann-Whitney U test).
(F) Relative height of VGluT2-labeled CF terminals in the molecular layer for Scr-Arc (open columns, n = 12 slices from 2 mice) and Arc KD (filled columns, n = 12 slices from 2 mice) cerebella. There was no significant difference between the two groups of PCs (P = 0.1124, Mann-Whitney U test).
See also Figure S6.

