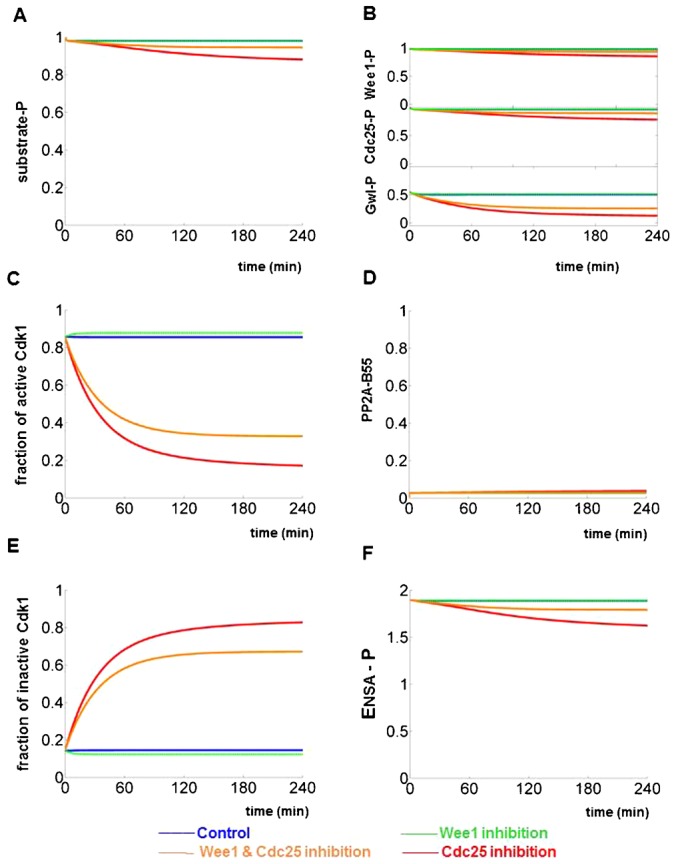
Fig. 4. Simulating the responses of mitotic cells to chemical inhibitors.

(A–F)The model is first allowed to reach a mitotic state, with high CycB level (1.3) and low PP2A-B55 activity, and time series simulations are started from this steady state. As in Fig. 2, different panels record the dynamics of different molecules and four colours are used to represent four different experimental conditions. The dynamics of phosphorylated mitotic substrate (A) is directly comparable to figure 6B of Potapova et al. (Potapova et al., 2011). All the other panels are model predictions.
