Figure 3.

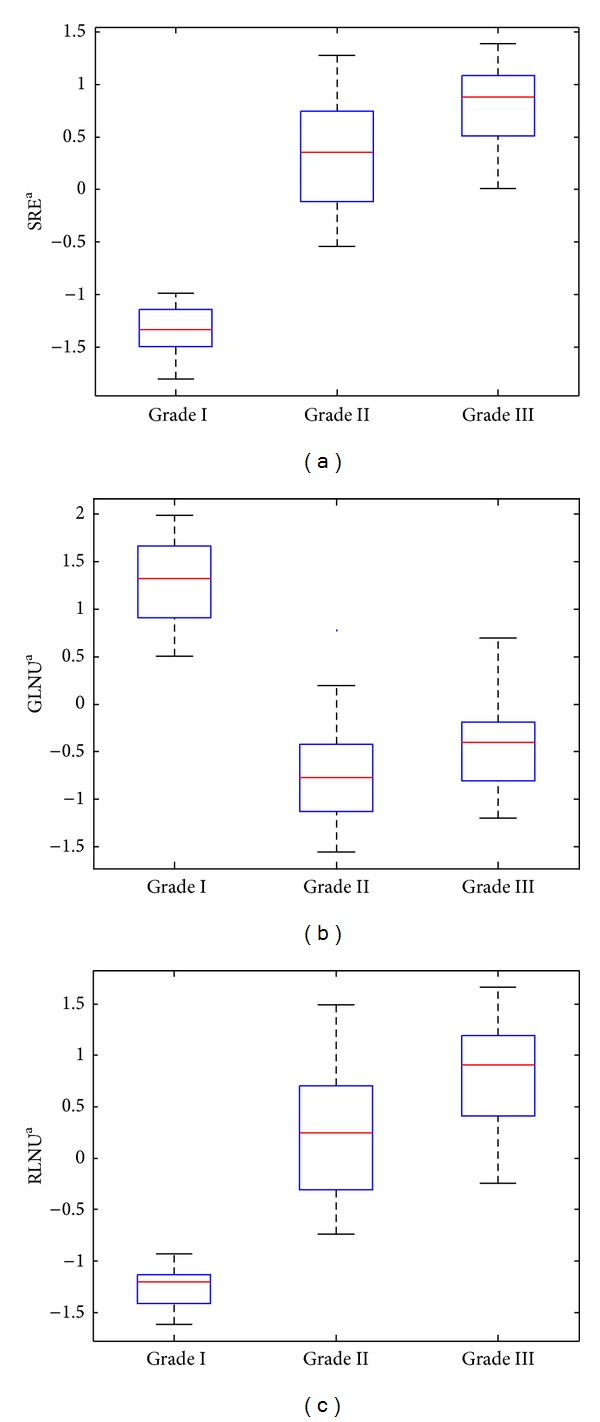
Box plots of short run emphasis, gray level nonuniformity, and run length nonuniformity features for the three histological grades. The horizontal line within each box represents median scores.

Box plots of short run emphasis, gray level nonuniformity, and run length nonuniformity features for the three histological grades. The horizontal line within each box represents median scores.