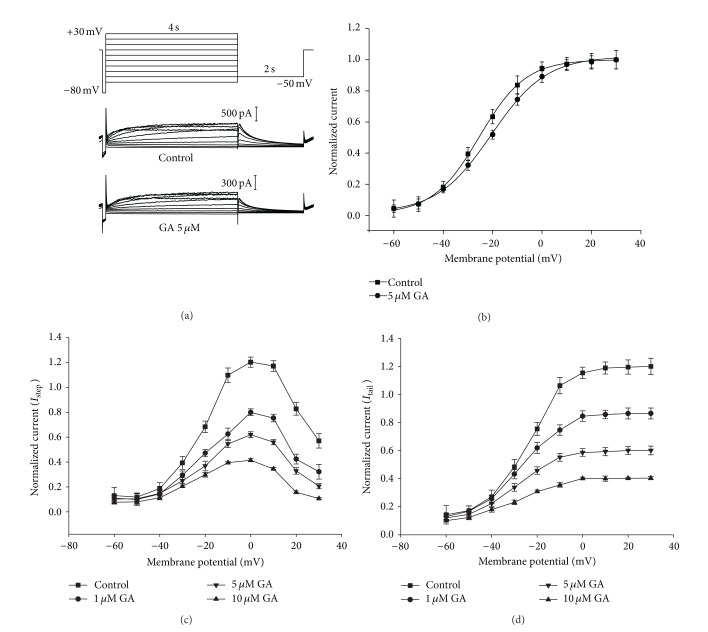
Figure 3.
Current-voltage relationship for HERG channels and blockade by GA. (a) HERG currents are illustrated under control conditions and in the presence of 5 μM GA recorded using the pulse protocol. (b) Voltage-dependent activation curves for the control and following GA exposure. Tail currents under control conditions and in the presence of 5 μM GA were normalized and fitted to the Boltzmann sigmoidal function. There were no significant differences in half-activation voltage (V 1/2) of 5 μM compared with the control (P > 0.05, n = 6). Data were expressed as mean ± SEM. Statistical comparisons were made using a two-tailed Student's t-test. Normalized (to respective control values) I-V relationships for current measured at the end of depolarizing steps (c) and tail currents (d) in the control and the presence of 1 μM, 5 μM, and 10 μM GA. Data are expressed as mean ± SEM; n = 6. Statistical comparisons were made using a two-tailed Student's t-test (P < 0.05, n = 6).

