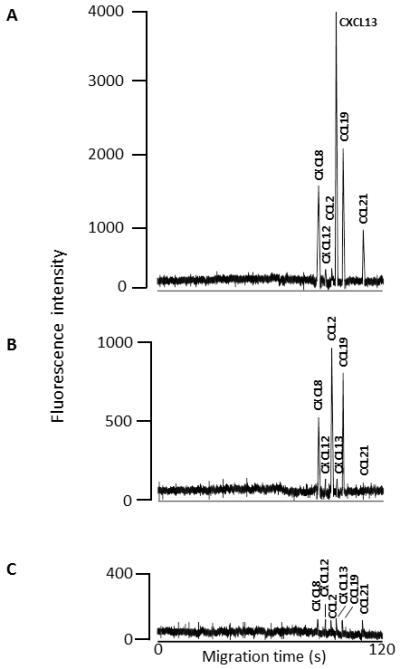
Figure 3.

Representative electropherograms from selected patients showing the different chemokine patterns in the three patient groups. The electrophoretic conditions are as described in section 2.6. A. Electrophoretic pattern obtained from running a sample from a patient demonstrating the electrophoretic pattern seen in patients from group A; B. Pattern obtained by running a sample from a patient demonstrating the electrophoretic pattern seen in patients from group B; C. Baseline pattern obtained by running a sample from a patient in group C. All electropherograms were recorded using the same detector scale and settings.
