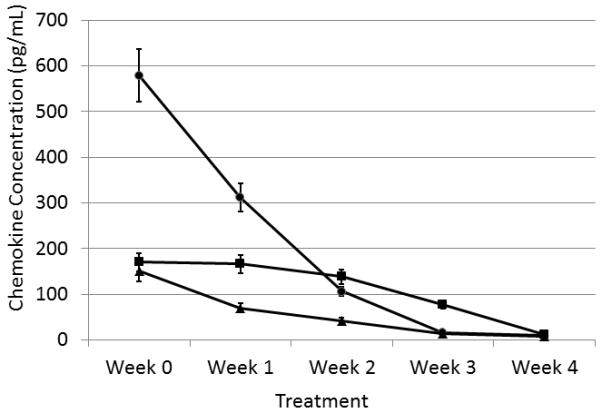
Figure 5.

Graph illustrating the concentrations of chemokines in the treated subjects from group A2 over time. The solid squares represent the concentrations of CCL19; the solid triangles the concentrations of CCL21; and the solid circles represent the concentrations of CXCL8. The error bars represent the mean ± SEM.
