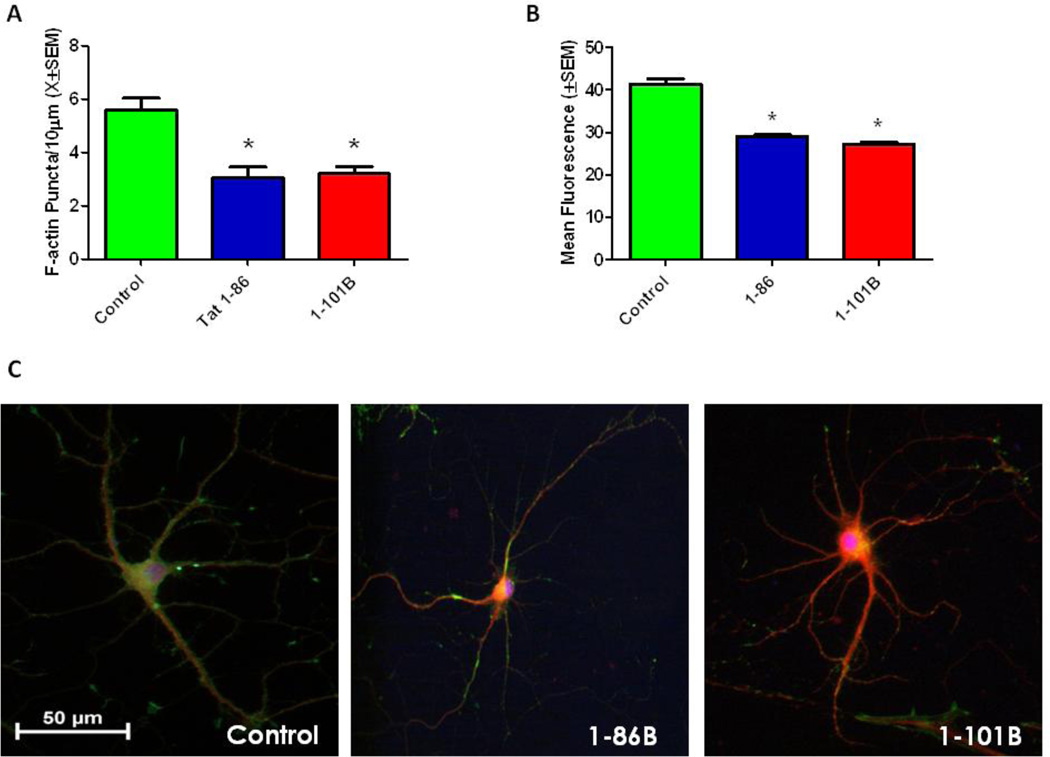
Figure 1. Tat 1–86 and Tat 1–101B Produce Similar Synaptodendritic Damage.
A. Tat 1–86 or Tat 1–101B treatment (50 nM) for 24 hours produced significant loss of F-actin puncta. Second order dendritic branches were selected from 20X images of F-actin/MAP2/Hoechst-stained Tat-treated and control pyramidal hippocampal neurons for puncta quantification. Results are presented as mean F-actin labeled puncta per 10µm of neuronal dendrite ± SEM. *- indicates a significant (p<0.05) difference relative to control.
B. Tat 1–86 and Tat 1–101B treatment (50nM) for 48 hours produced significant cell death. Fluorescent units were determined in hippocampal cell cultures using Live/Dead assays. Results are presented as mean fluorescence values ± SEM. *- indicates a significant (p<0.05) difference relative to control.
C. Control, Tat 1–86 (50nM) and Tat 1–101B (50nM) treated neurons labeled with F-actin(Green)/MAP-2(Red)/Hoescht(Blue). The hippocampal pyramidal neuron in the control condition demonstrated robust F-actin labeling (green) and complex branching patterns. Both of the Tat treated neurons had greatly diminished F-actin staining (green), and decreased dendritic branching (red) relative to controls. Scale bar = 50 microns

