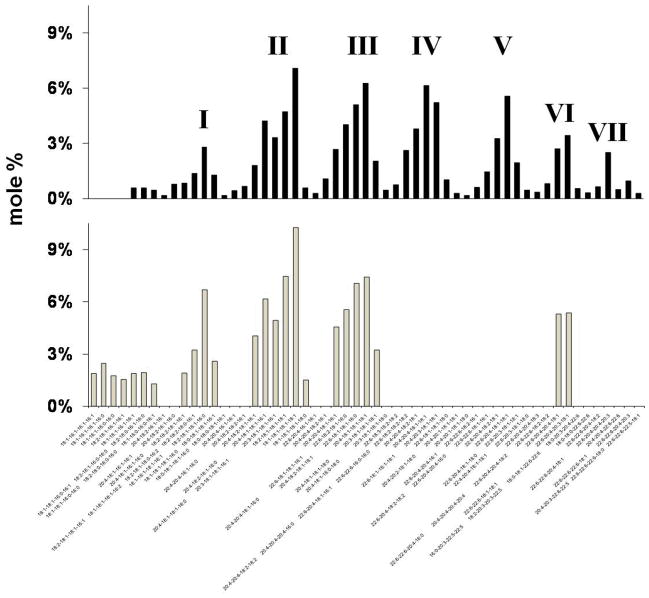
Fig 2. Distribution of brain cardiolipin molecular species in B6 NS (black bar) and VM NS (grey bar) mitochondria.
Cardiolipin molecular species were arranged according to mass charge. Corresponding molecular species mass content can be found in supplementary Table 6. Molecular species can be arranged into seven groups (I – VII) based on chain length and degree of unsaturation.

