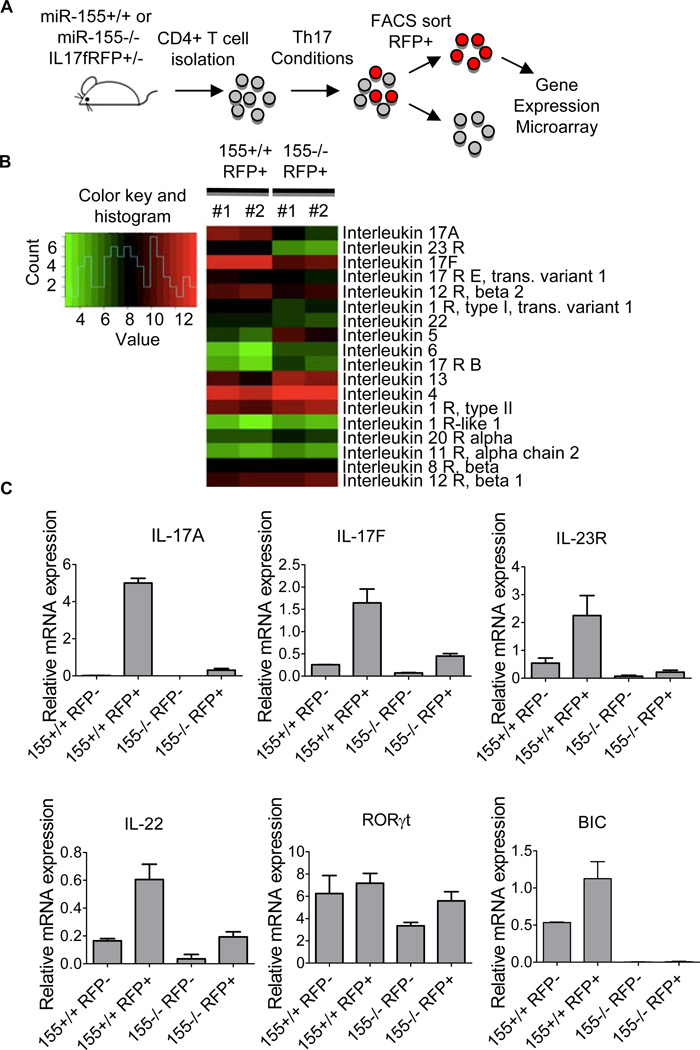
Figure 2. miR-155 regulates Th17-related genes in purified IL17F+ Th17 cells.
(A) Schematic diagram of the experimental design. (B) Heatmap of the differentially expressed interleukin genes in miR-155+/+ versus miR-155−/− IL-17F+ Th17 cells (n=2). The colors represent normalized fluorescence values on a log scale. The color key is next to the heatmap. (C) Relative expression levels of bic ncRNA and IL-17A, IL-17F, IL-23R, RORgT and IL-22 mRNA in FACS sorted T cells from (B) were assayed by qPCR (n=2). Error bars represent +/− SEM.

