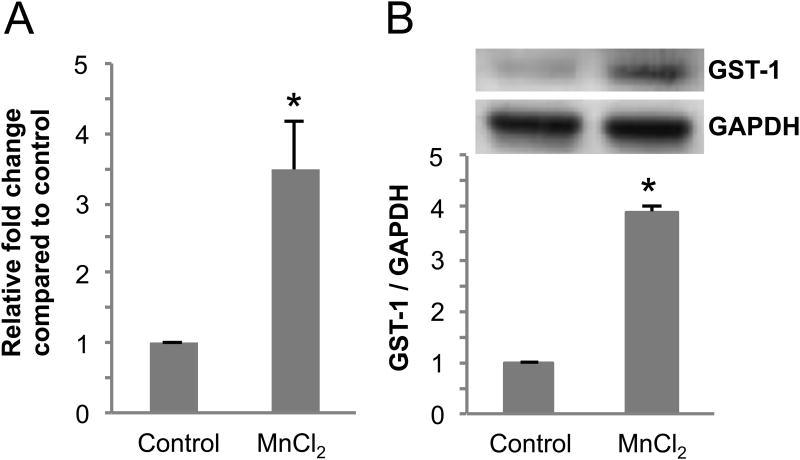
Fig 1. Exposure to Mn induces GST-1 gene and protein expression.
(A) Synchronized L1 stage WT C. elegans were exposed to 50 mM MnCl2 for 30 mins, mRNA was extracted and reverse transcribed to cDNA. Relative gene expression changes of gst-1 were quantitated using real-time PCR. The fold change in gene expression relative to GAPDH was calculated following the ΔΔCt method. Shown are mean ± S.E. of three individual replicates. p value was calculated using t-test analysis. Asterisk indicates p ≤ 0.04 between control and toxicant-exposed group ΔCt values. (B) Synchronized L1 stage WT nematodes were exposed to 50 mM MnCl2 for 30 mins and allowed to recover for 24 h on NGM plates at 20°C. Following recovery/exposure, the worms were collected, homogenized and protein was quantified following standard a Bradford assay. For Western blot analysis, protein samples were separated by electrophoresis, transferred to a membrane, and probed with anti-GST-1 or GAPDH primary antibodies. Shown are mean ± SE of at least three individual replicates. p values were calculated using t-test analysis. Asterisks indicate p ≤ 0.03 between controls and Mn-exposed groups.

