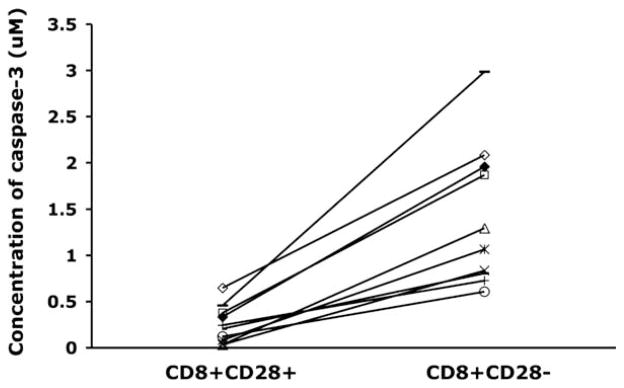
FIGURE 6.

Higher levels of caspase-3 in CD8+CD28− vs CD8+CD28− T cells tested immediately ex vivo. CD8+ T cells were separated into CD28+ or CD28− subpopulations by magnetic bead selection, and purity of each subpopulation was confirmed by flow cytometry. Caspase-3 activity was measured as in Fig. 5, using the Apo-Alert colorimetric assay (n = 10). Results for the CD28+ and CD28− subpopulations from each donor are connected by a line. The difference in caspase-3 activity was highly significant (p < 0.001).
