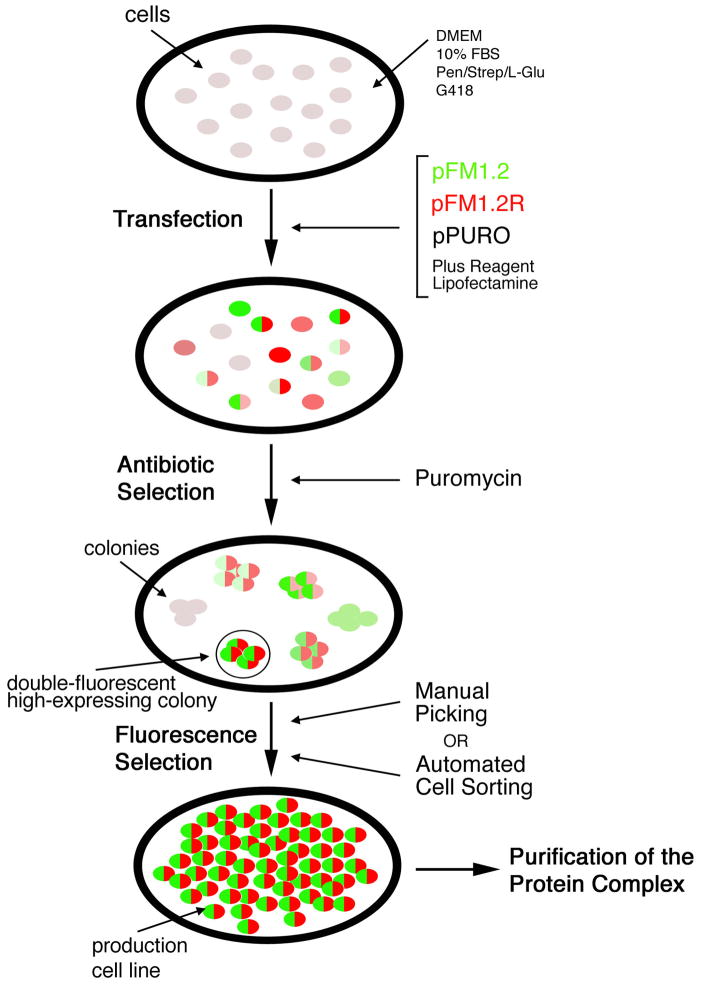
Figure 2.
Flow chart of the two-color selection system. Required procedures, from transfection, to antibiotic selection, to fluorescence selection, are schematized. The intensity of the colors is intended to represent the intensity of the emitted fluorescence for GFP (in green) and RFP (in red). Double fluorescent cells are drawn with two colored halves. Cells expressing only one fluorescent marker are represented with the matching color. Un-transfected cells, and cells expressing neither GFP nor RFP are drawn in light grey.

