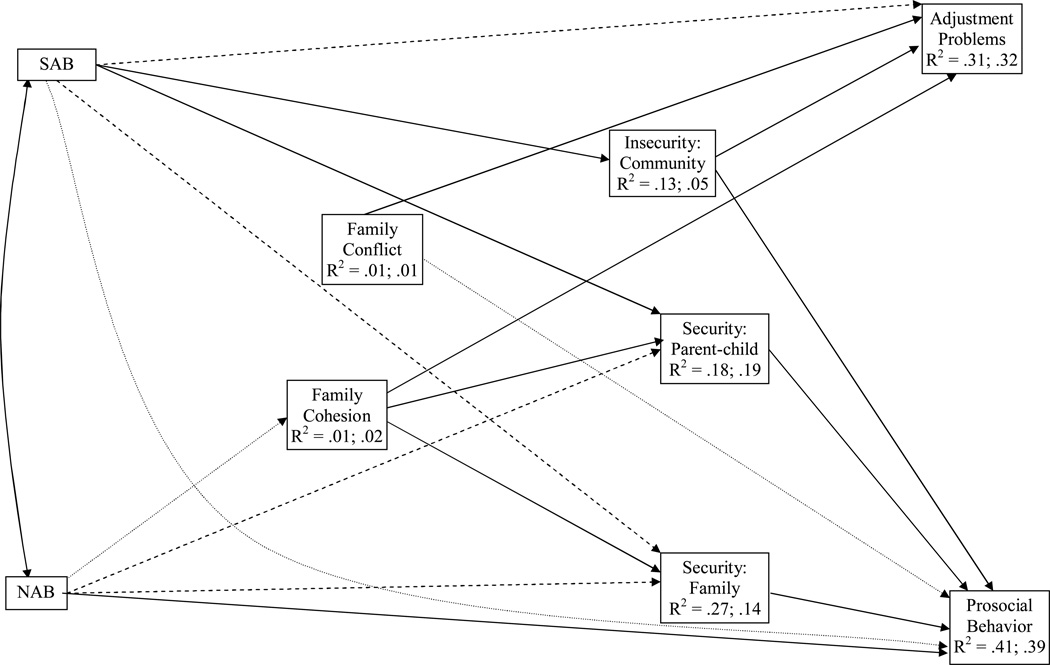
Figure 2.
Comparisons of pathways in the social ecological model for single and two parent families. Solid lines denote paths that are significant for both groups, dashed lines denote paths only significant for single parent families, and dotted lines denote paths only significant for two parent families. R2 values are reported for each significant pathway. SAB = Sectarian Antisocial Behavior; NAB = Nonsectarian Antisocial Behavior. Fit indices: χ2 = 8.340, df = 4, p > .05, χ2/df = 2.085, NFI = .996, CFI = .998, and RMSEA = .040. *p < .05. **p < .01. ***p < .001.

