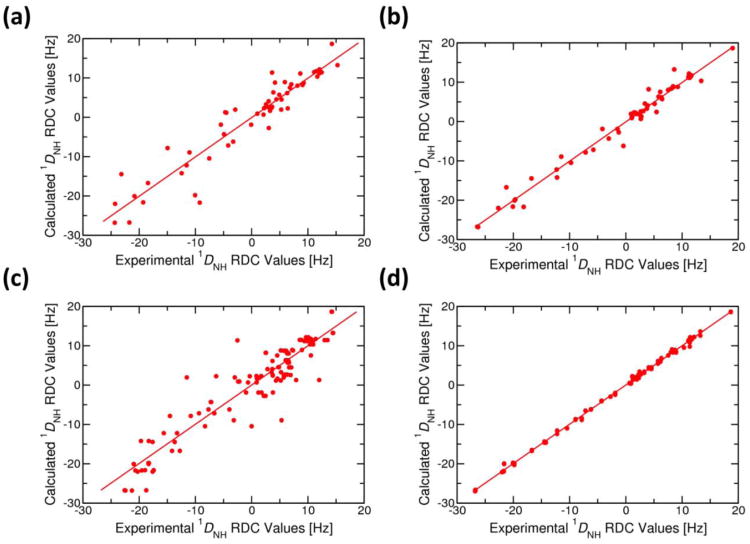
Fig. 2.
(a) Correlation of experimental backbone NH (1DNH) RDC constraints with those calculated from (a) the 1R1V crystal structure of Zn-bound CzrA (R = 0.944; y = 1.002x + 0.036), (b) the average NMR solution structure for the 2KJC ensemble (R = 0.988; y = 0.999x − 0.078), (c) model 1 of the 2KJC ensemble of NMR structures before (R = 0.934; y = 0.994x − 0.178) and (d) after the metal ion refinement MRD-NMR procedure described here (R = 0.999; y = 0.997x + 0.017). R is the correlation coefficient and the equation of the fitted line is in the form of y = mx +c where, ‘m’ defines the slope of the line and ‘c’ the value of x at y=0

