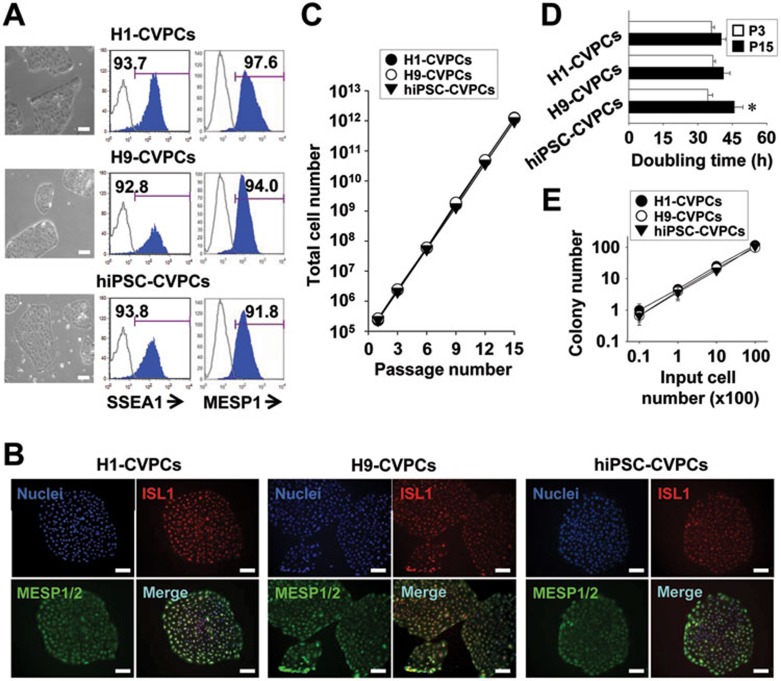
Figure 3.
Long-term maintenance of hPSC-derived CVPCs. (A) Representative images showing the typical morphology (left panels), the SSEA1 and MESP1 expression analyzed by flow cytometry (middle and right panels). The control sample used in this assay was a 1:1:1 mixture from all three types of parental cells examined (H1-, H9-hESCs and hiPSCs). (B) Representative images of the ISL1 and MESP1 expression analyzed by immunostaining of CVPC colonies at passage 15. Scale bar = 100 μm. (C, D) Growth curves (C) and mean doubling time (D, n = 3) of CVPCs. *P < 0.05 vs P3. (E) Cell dose response experiments showing the lineage relationship between the number of cells plated and the number of colonies developed (n = 3). Scale bars = 100 μm.

