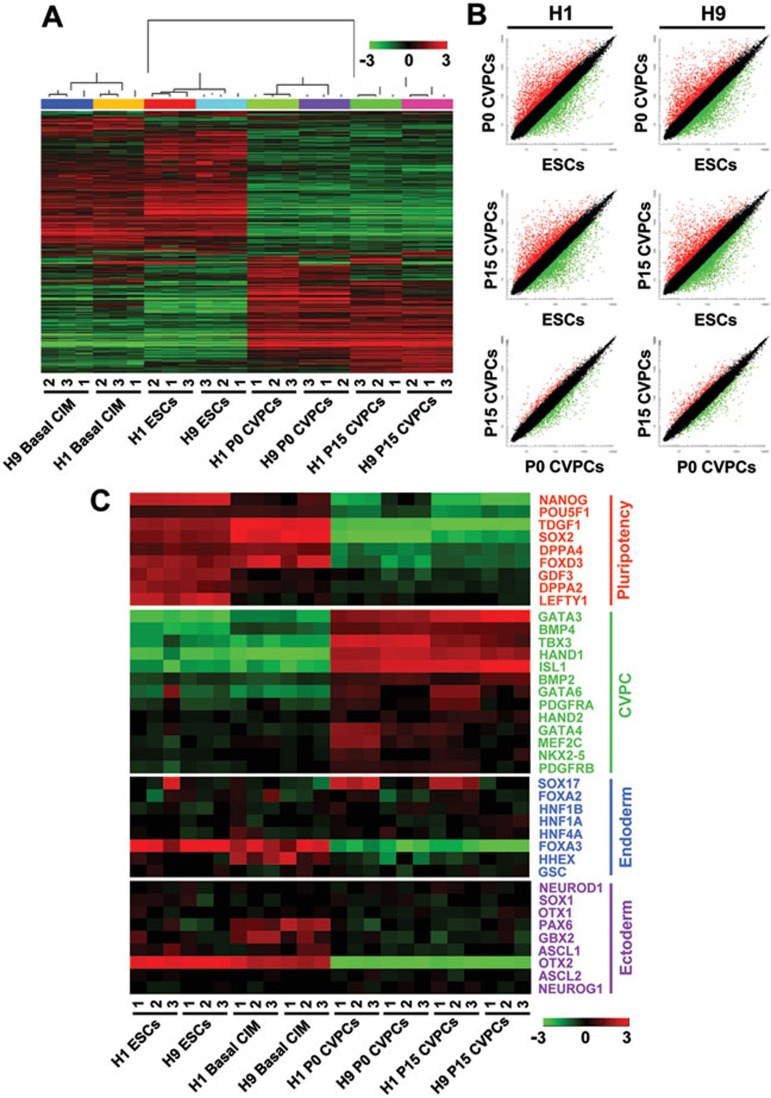
Figure 4.
Genome-wide transcriptional profiling of CVPCs. (A, B) Hierarchical clustering (A) and scatter plot (B) analysis of global gene expression patterns in hESCs cultured in the basal CIM, ESCs, and CVPCs at passage 0 (P0) or 15 (P15), derived from either H1 or H9 hESCs. The expression values in log2 scale in A were calculated and presented on the heat map with red representing upregulated genes and green representing downregulated genes. Black dots in B indicate the population with less than two-fold differences in gene expression levels between both samples. (C) Heat map showing expression levels of key marker genes related to pluripotency, CVPC, definitive endoderm, and neuronal ectoderm.

