Figure 6.
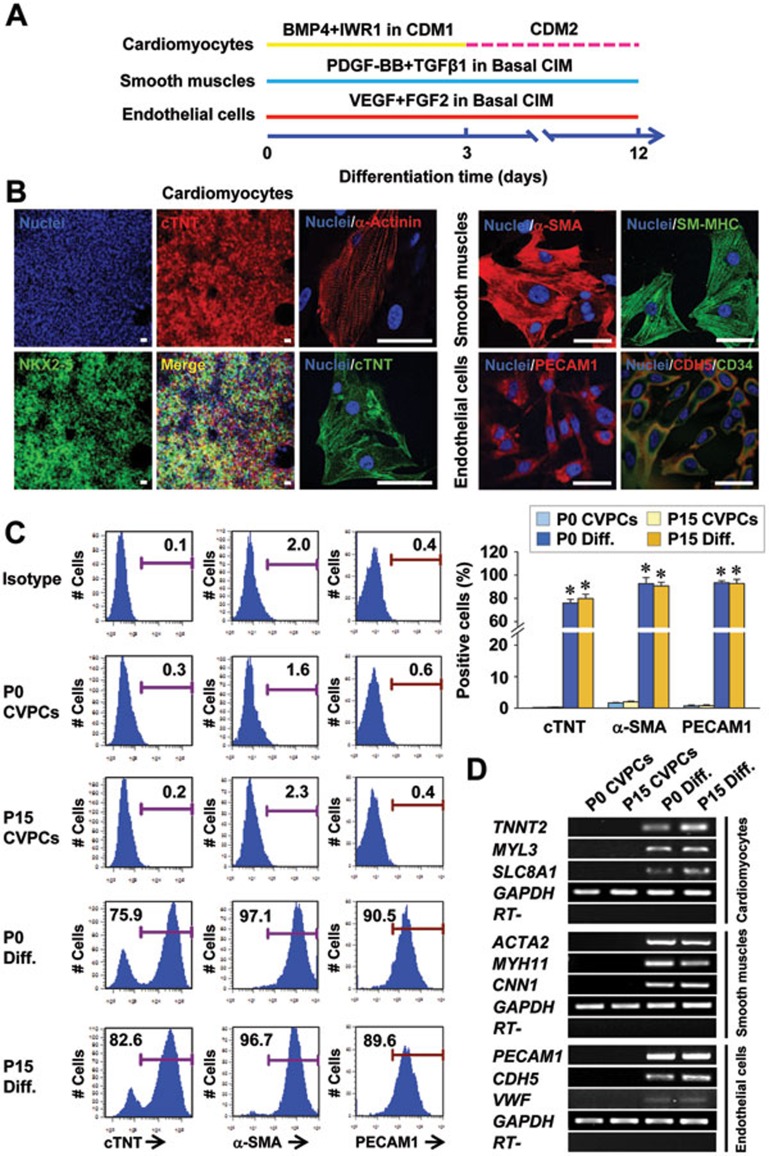
In vitro differentiation potential of CVPCs. (A) An outline of the conditions for inducing CVPC differentiation. (B) Differentiation potential of P15 CVPCs into cardiomyocytes, smooth muscle cells and endothelial cells determined by immunostaining analyses for NKX2-5 (green), cTNT (red or green), α-Actinin (red) and merged NKX2-5 with cTnT in cardiomyocytes, α-SMA (red) and SM-MHC (green) in smooth muscle cells, and PECAM1 (red), CDH5 (red), and CD34 (green) in endothelial cells after treatment in respective patterning conditions for 12 days. Scale bars = 50 μm. (C) Representative (left panels) and averaged FACS population analysis of cTNT+ (CM marker), α-SMA+ (SMC cell marker) and PECAM1+ (EC marker) cells from P0 and P15 CVPCs before or after treatment in respective patterning conditions for 12 days. n = 3. *P < 0.01 vs CVPC. (D) RT-PCR analysis showing the expression of cardiovascular derivate markers in various groups.

