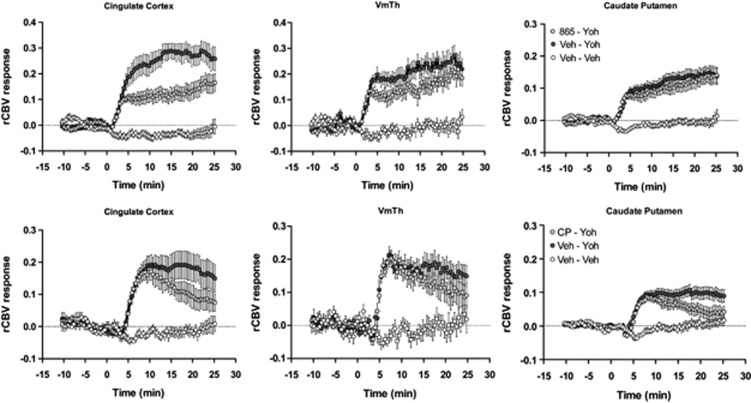
Figure 2.
Temporal profile of yohimbine-induced relative cerebral blood volume (rCBV) response in representative anatomical volumes of interest. Yohimbine was injected at time 0. Data are plotted as mean±SEM within each group (veh, vehicle; Yoh, yohimbine; CP, CP154,526; 865, GSK1059865; VmTh, ventromedial thalamus).

