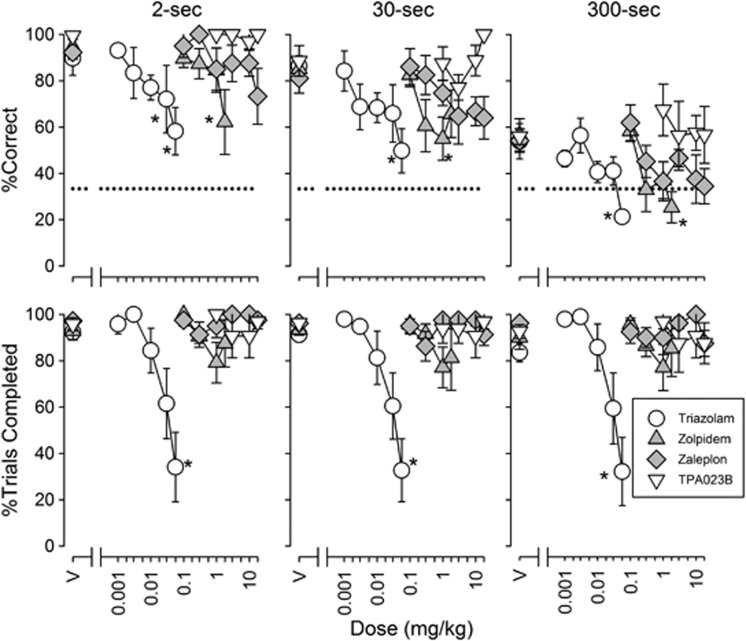
Figure 1.
Effects of triazolam (n=6), zolpidem (n=6), zaleplon (n=5), and TPA023B (n=4) on accuracy (top row) and trial completions (bottom row) for trials at each delay value in the delayed matching-to-sample (DMTS) procedure. Points above ‘V' represent results following vehicle administration. Each data point represents the mean across monkeys. Error bars represent ±1 SEM. The horizontal dashed line indicates a chance accuracy (33.3%). Statistically significant post-hoc comparisons relative to vehicle are denoted by asterisks.

