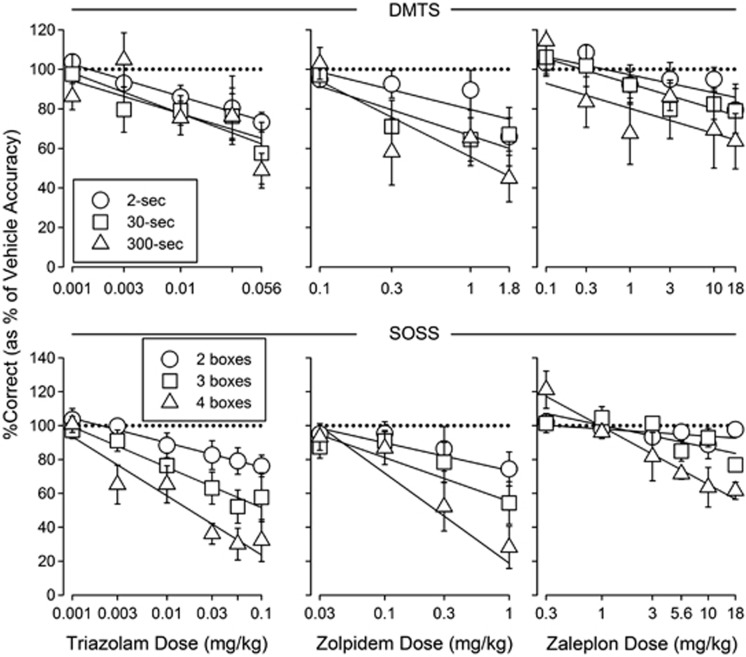
Figure 5.
Normalized (% of vehicle accuracy values) dose-response curves along with best-fitting straight lines for triazolam's (left), zolpidem's (middle), and zaleplon's (right) effects on delayed matching-to-sample (DMTS) (top) and self-ordered spatial search (SOSS) (bottom) accuracy. Each data point represents the mean across monkeys. Error bars represent ±1 SEM. The horizontal dotted lines are for reference and indicate 100% of vehicle accuracy. Solid lines represent best-fitting lines. Other details are as in Figures 1 and 2 for DMTS and SOSS, respectively.

