
Figure 5. RT-PCR analysis of the expression of ASCT1, ASCT2 and ATB0,+in rMC-1 and 1°MCs.
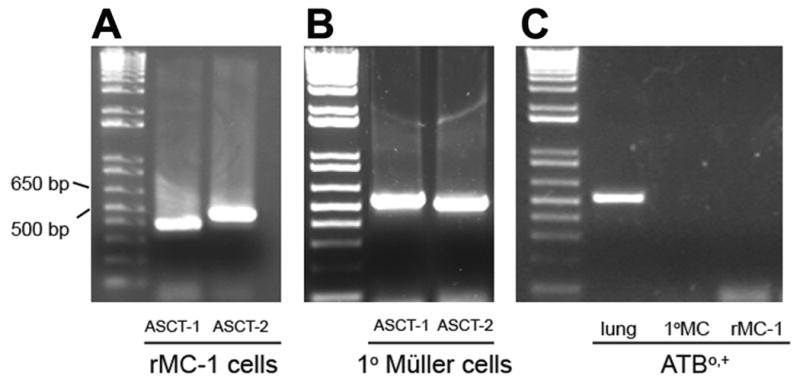
(A) Total RNA (1 μg) isolated from rMC-1 cells was reverse-transcribed into cDNA and subjected to PCR using rat-specific ASCT1 and ASCT2 primers yielding products with the expected band sizes of 399 and 478 bp, respectively. (B) Total RNA (1 ug) isolated from 1°MCs reverse-transcribed into cDNA and subjected to PCR using mouse-specific ASCT1 and ASCT2 primers yielded products with the expected sizes 536 and 506, respectively. (C) Total RNA (1μg) was isolated from mouse lung (positive control), rMC-1 and 1°MCs, reverse-transcribed into cDNA, and subjected to PCR using primers specific for mouse or rat ATB0,+. The mouse lung yielded a product with the expected band size of 617 bp; however, neither rMC-1 nor 1°MCs yielded any PCR product for ATB0,+. In each panel, the left lane represents DNA markers and the band sizes of 500 bp and 650 bp are labeled.