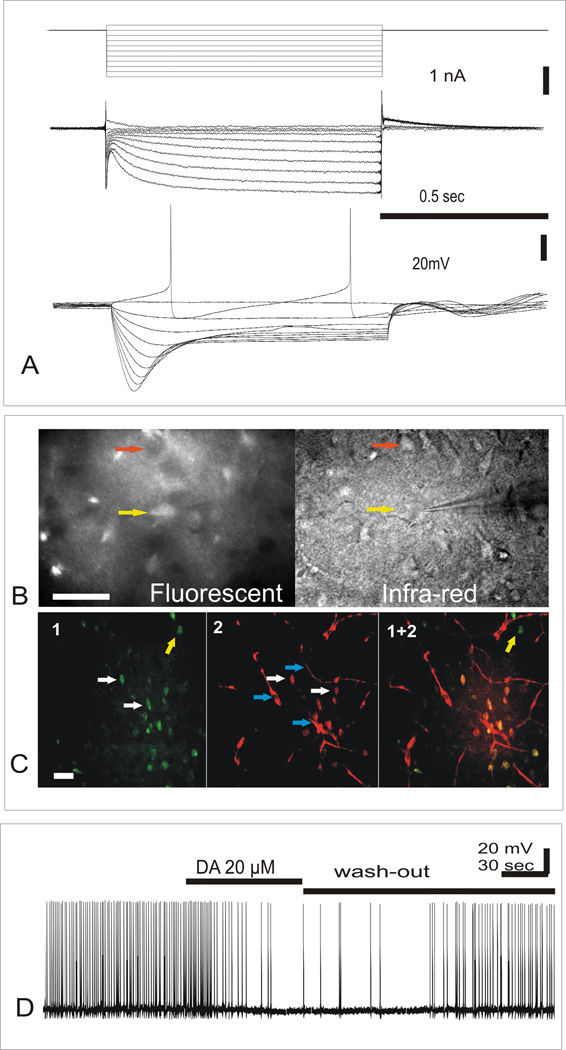
Fig.1.
A. Whole cell patch-clamp recording from fluorescent cells after slice being stained with 100 nM ASP+. Upper trace: Stimulation step protocol (see. Methods), Middle trace: Recording of fluorescent DA neuron currents as a response to series of 10 (1 sec) 10 mV voltage step stimulations, from −30 to −120 mV. Lower trace: Recording of DA neuron voltage responses to series of 10 (1 sec duration) 200 pA current step stimulations, from +200 pA from holding level to −1400 pA (−45 mV).
B. Fluorescent (left) and infra-red (IR) image (right) of path-clamp recording from fluorescent neuron in VTA. Electrode is positioned to record from fluorescent neuron (yellow arrow) that coincides with infra-red image of neuronal cell body, while another neuronal cell body(red arrow) that have no florescence can be seen in IR image as well. Scale:100 µm.
C. Double staining of VTA neurons with Falck-Hillarp method and ASP+. From left to right: (1) F-H fluorescence (green); (2) ASP+ fluorescence (red); and (1+2) their colocalization (see Methods). White arrows point to fluorescent neuronal cell bodies that coincide in 1 and 2. Yellow arrow point on neuronal cell body that have F-H fluorescence but have no ASP+ fluorescence. Blue arrows point to blood vessels. Scale:100 µm. (See also web content for animated picture).
D. External application of 20 µM of dopamine produced visible inhibition of fluorescent neuron activity.

