
Figure 1.
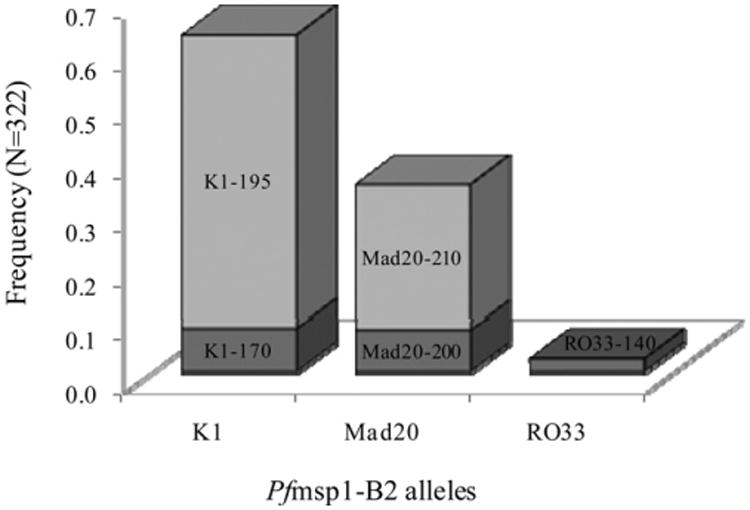
Frequencies of Pfmsp1-B2 allele types. Shading is used to discriminate between individual alleles within each bar on the graph. Individual allele frequencies are shown, with allelic families on the x-axis and respective frequencies on the y-axis.