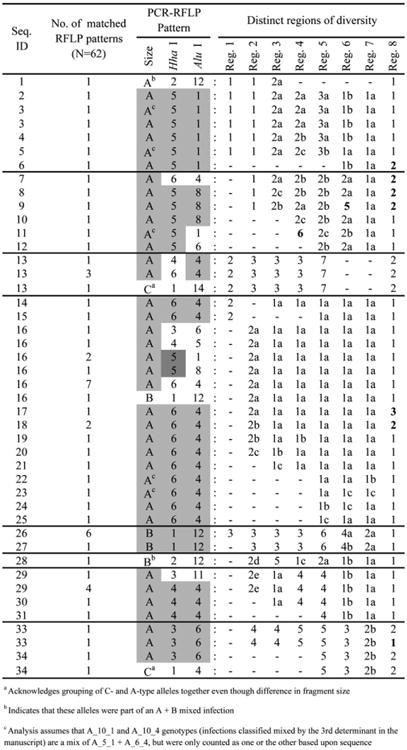
Figure 4.

Regions of Pvmsp3α sequence diversity correlated to PCR-RFLP genotyping data. Groupings were made based on a similarity of 90% between each region. Varying shades of gray within these PCR-RFLP patterns indicate relatedness within the group. Group numbers are given such that the smallest numbers represent the most frequent sequence code in the region. Differences of a single amino acid within a group are denoted by the grouping number followed by a lowercase letter. Numbers in bold indicate a difference greater than a single amino acid change. GenBank accession numbers: FJ612066–FJ612105.
