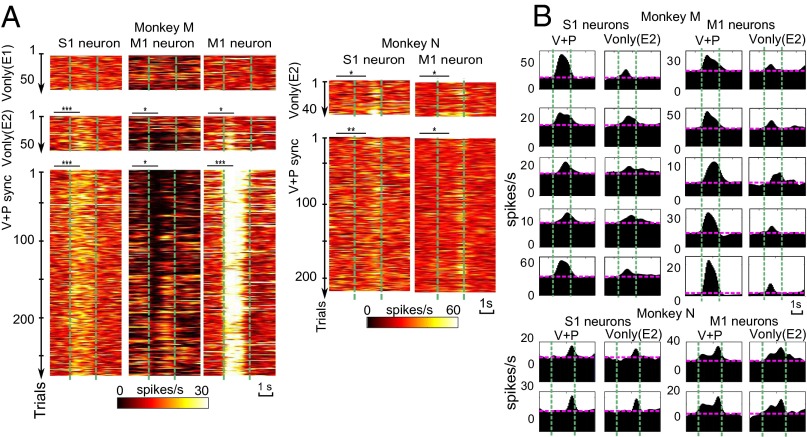
Fig. 2.
Example neurons. (A) Single-trial PSTHs for three neurons in monkey M and two neurons in monkey N. From top to bottom: Vonly trials during E1 (for monkey M only), Vonly trials during E2, and V+P sync trials during E2. Vertical lines represent the onset and offset of the brushing. Asterisks indicate significant deviations of neuronal rates from baseline by Wilcoxon test: *P < 0.05, **P < 0.01, and ***P < 0.001. (B) Representative PSTHs for V+Psync and Vonly conditions. Pink horizontal lines represent baseline rates.

