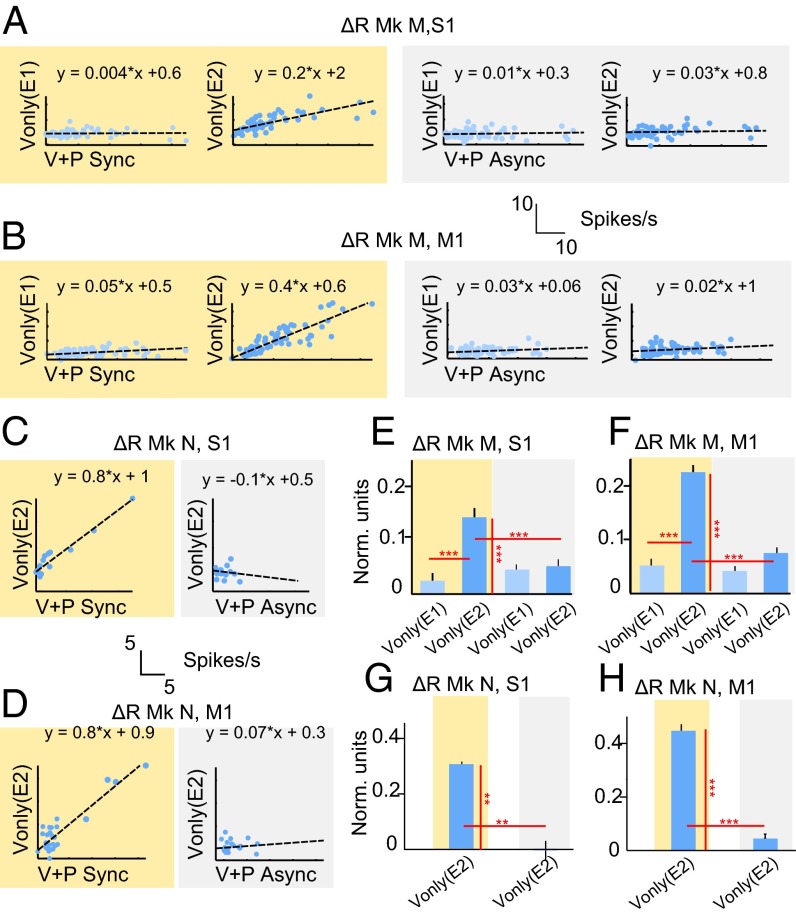
Fig. 4.
Analysis of responses to virtual and physical touch. (A–D) Scatter plots for the correlation analysis of responses in different conditions. Each dot represents an individual neuron. V+P response magnitude (in spikes per second) is plotted against Vonly response magnitude. The results of linear regression are indicated by dashed lines, and corresponding functions are shown above the figures. (E–H) Bar plots representing mean and SEM for response amplitude in Vonly trials across cortical areas, monkeys, epochs (i.e., E1 and E2), and experimental conditions. Synchronous sessions are indicated by yellow background, asynchronous by gray background. Firing rates are normalized to z-scores. Only the neurons with significant excitatory responses to physical touch were considered. Asterisks indicate significant differences by Wilcoxon test: *P < 0.05, **P < 0.01, and ***P < 0.001.

