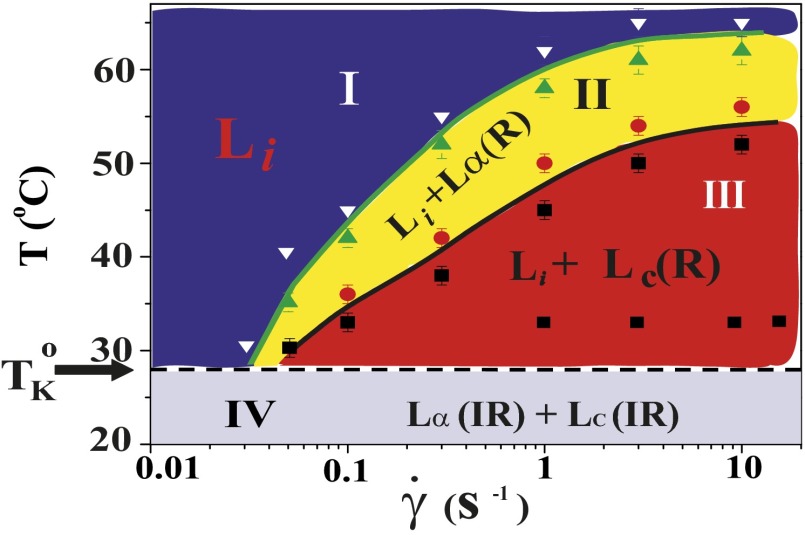
Fig. 1.
Shear diagram for the isotropic phase  . Region III (shaded in red) demonstrates the coexistence of
  with the shear-induced crystalline phase
  . Coexistence of the
  and
and  phases is observed in region II (shaded in yellow). The crystalline
  and lamellar
  phases nucleate irreversibly in the
  phase under shear (region IV, shaded in blue) below
  . Only the transitions above
  (indicated by the dashed line) are reversible under shear. The approximate boundaries demarcating different regions are shown by solid lines. The data points corresponding to the final phases, constructed from the stress relaxation measurements, are shown by different symbols indicating
  (inverted white triangles),
  (green triangles and red circles), and
  (black squares).

