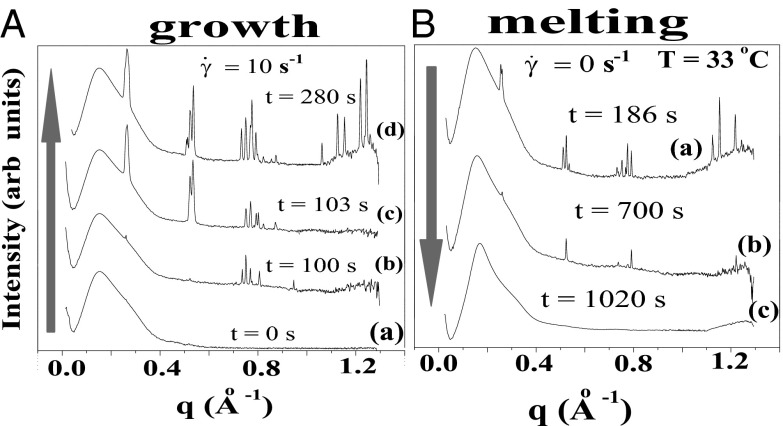
Fig. 3.
Time-resolved Rheo-SAXS data of the  phase (corresponding to region III, Fig. 1) in the radial geometry at T = 33 °C indicates growth of the
  phase with time, at 10 s−1, in which the times shown correspond to that from the start of shear (A) and melting of the
  phase at 33 °C on stopping the shear, in which the times shown correspond to that from the stoppage of shear (B).

