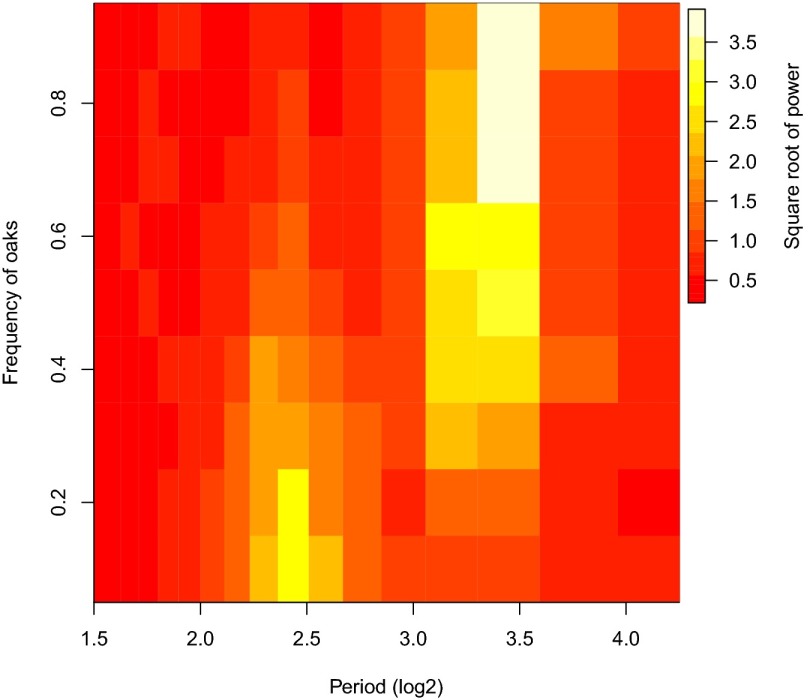
Fig. 4.
Effects of oak frequency on the power spectrum of the defoliation time series in the spatial model. The colors show the square root of the power of each period, such that dark red indicates the lowest power and white indicates the highest power. The figure thus shows that, at a low frequency of oaks, only short period cycles occur, whereas at a high frequency of oaks, only long period cycles occur. The relative importance of short-period and long-period cycles then gradually shifts as the frequency of oaks increases, so that both short-period and long-period cycles are represented in the power spectrum at intermediate frequencies of oaks.

