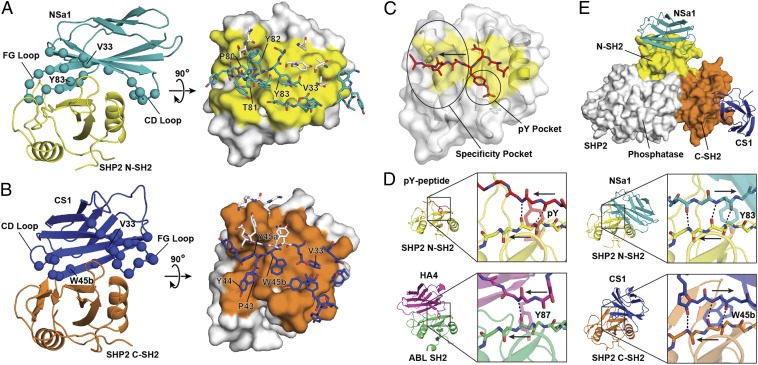
Fig. 3.
Crystal structures of SHP2 SH2/monobody complexes [Protein Data Bank (PDB) ID codes 4JE4 and 4JEG]. (A) The monobody NSa1/N-SH2 complex. (Left) Cartoon representation with NSa1 in teal, N-SH2 in yellow, and residues diversified in the library shown as spheres. (Right) Orthogonal view of the interface, in which N-SH2 is represented as a surface model with the epitope in yellow and residues within the paratope of monobody NSa1 are represented as sticks. Residues that were not diversified in the library are shown as white sticks. (B) The CS1/SHP2 C-SH2 complex. The labeling scheme is similar to that in A, except that monobody CS1 is in blue and C-SH2 is in orange. (C) Interface of a phosphopeptide with SHP2 N-SH2 (31) (PDB ID code 3TL0) showing the typical positions of the pY-binding and specificity pockets of SH2. The arrow shows the direction of the bound peptide. (D) The binding modes of a pY peptide, HA4, NSa1, and CS1 to their respective cognate SH2 domains. Intermolecular hydrogen bonds are shown as dashed lines, and the directions of the strands are labeled with the arrows in the expanded boxes. (E) Overlay of NSa1/N-SH2 and CS1/C-SH2 complexes on autoinhibited SHP2 (10) (PDB ID code 2SHP). SHP2 is represented as a surface model with the N-SH2 and C-SH2 domains colored yellow and orange, respectively, and the phosphatase domain in white. Monobodies NSa1 and CS1 are represented as cartoon models colored teal and blue, respectively.

