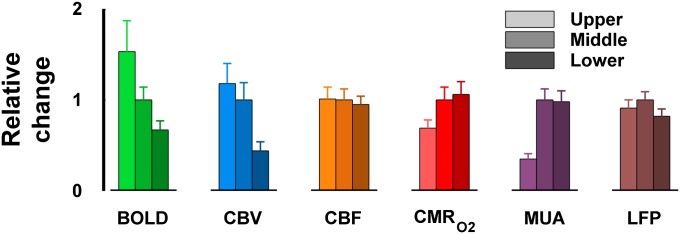
Fig. 2.

Summary of multimodal functional responses. All data shown as means ± SEM (Fig. 1). Relative functional responses obtained by normalized values with respect to the response from the middle layer for each modality. Transition from upper to middle to lower segments are shown by darker shades (for each respective color/modality). Statistical analysis for BOLD data showed that all layer-specific comparisons were significant (i.e., upper vs. middle P = 0.09, upper vs. lower P < 0.01, and middle vs. lower P < 0.05), whereas for CBV data only upper vs. middle was insignificant (i.e., upper vs. lower P < 0.002 and middle vs. lower P < 0.006). BOLD responses decreased from upper to middle by ∼50% and then by another ∼50% from middle to lower segments, whereas CBV responses reduced from upper/middle to lower segments by ∼60%. All layer-specific comparisons for CBF data were insignificant, but CBF responses decreased from upper/middle to lower segments by ∼10%. Statistical analysis for CMRO2 data showed that only middle vs. lower was insignificant (i.e., upper vs. middle P < 0.08 and upper vs. lower P < 0.006), quite similar to the MUA data (i.e., upper vs. middle P < 0.01 and upper vs. lower P < 0.001). From middle/lower to upper segments CMRO2 responses reduced by ∼30% and MUA responses decreased by ∼50%. Like the CBF statistical analysis, the LFP data showed that all layer-specific comparisons were insignificant, but LFP responses peaked in the middle segment by ∼20%. Table S2 and Fig. S2 give details on correlations.
