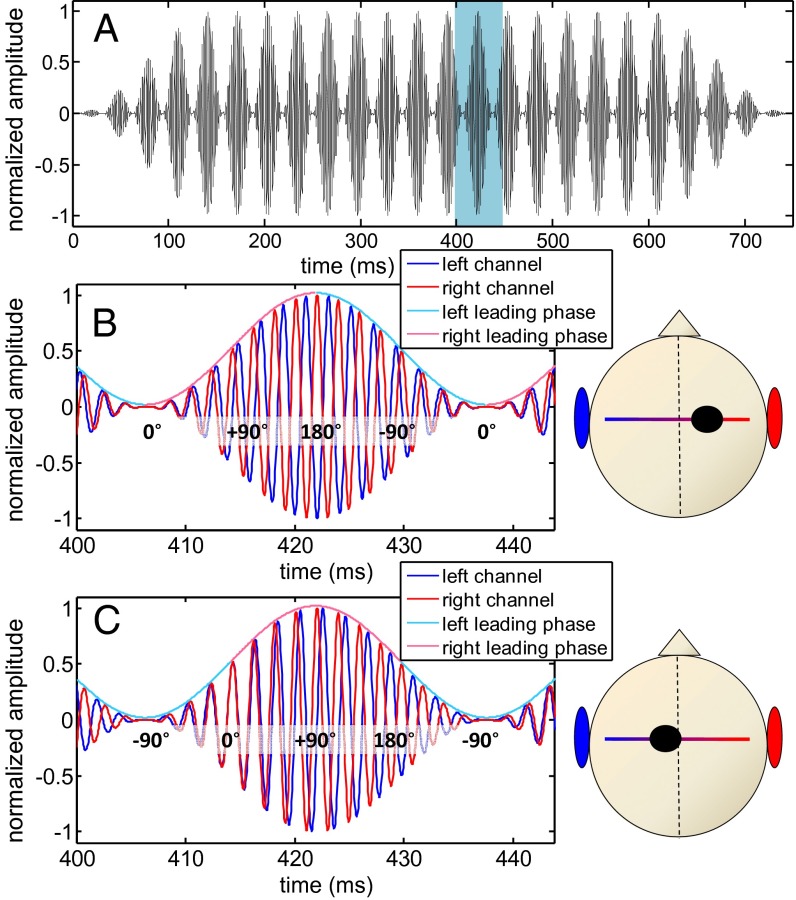
Fig. 2.
Waveform of the AMBB stimulus; 500-Hz sinusoidally amplitude-modulated tone with a 32-Hz beat frequency and AM rate. (A) Full waveform of one channel. (B) A 45-ms segment of the AMBB from A: fleft < fright with “start IPD” at modulation minimum IPDStart = 0. The left channel is in blue, and the right channel is in red. The color of the envelope indicates the sign of the instantaneous IPD (blue, left leading; red, right leading). Some values of the instantaneous IPD are plotted over the signals. All subjects perceived such a stimulus clearly from the right as indicated by the dot within the cranial diagram. (C) Same format as B but now with IPDStart = −90°. In this particular case, the IPD is right-leading when the amplitude is large (>0.5) and left-leading when the amplitude is small (<0.5). Most subjects perceive this stimulus slightly to the left even though the stimulus intensity is low during left-leading IPDs.

