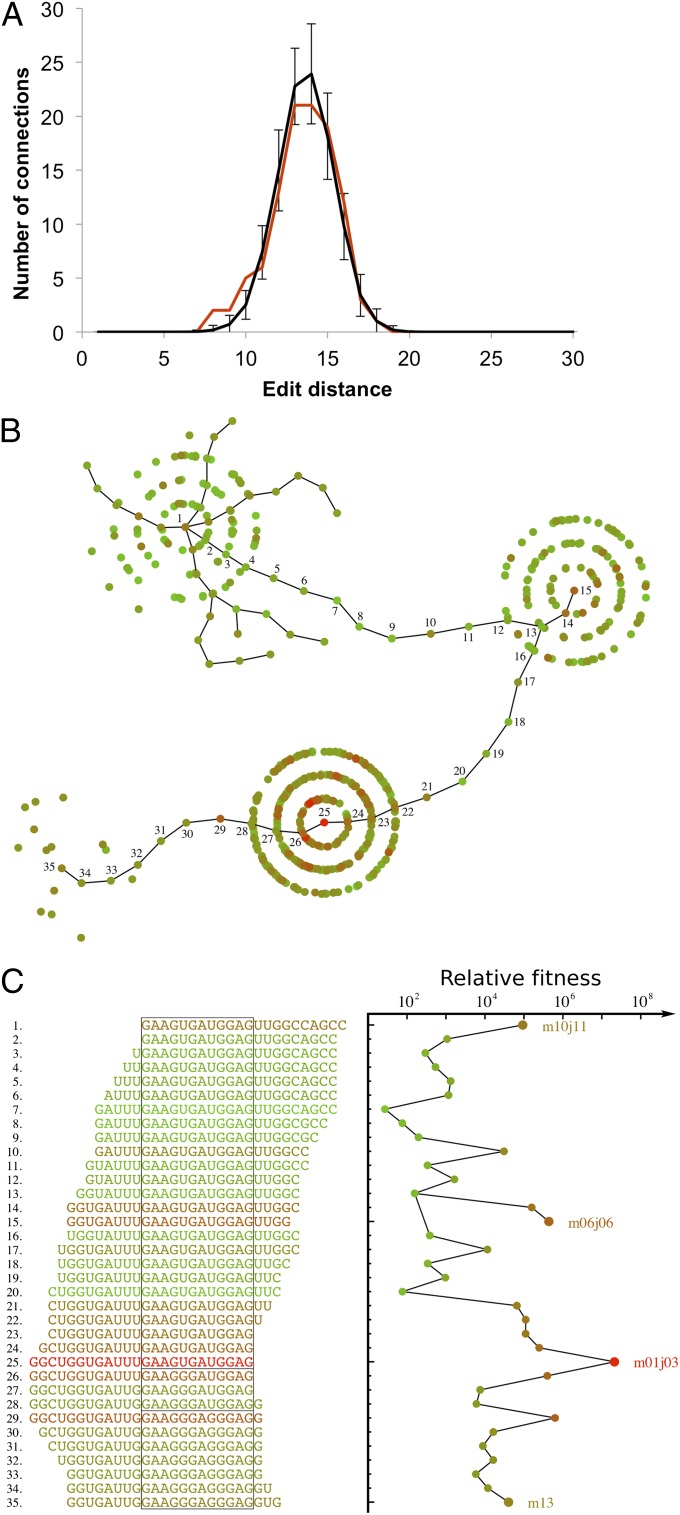
Fig. 3.
Connectivity of fitness peaks. (A) The distribution of interpeak edit distances for the 15 peaks found in common between both experiments is shown in red. The control distribution for randomly chosen sequences is shown in black, with SDs given by the error bars. Note the difference between distributions at low edit distance. SI Appendix, Fig. S9 shows similar plots for individual experimental replicates. (B) Potential evolutionary pathways form limited connections among fitness peaks. Each point corresponds to an observed sequence (round 3), with color corresponding to relative fitness, as given in C. Sequences along the connecting pathways are numbered; other sequences from the involved peaks are also shown. Dead-end pathways are also present; a few such “tendrils” are shown surrounding peak m10j11 for illustration. (C) Plot of relative fitness along the pathways with sequences given along the vertical axis. Color corresponds to fitness (red is high; green is low). Peak sequences are labeled in the plot. Pathways among the three main peaks were identified in both replicates; the smallest peak (m13) was only identified in one replicate.

