Fig. 3.
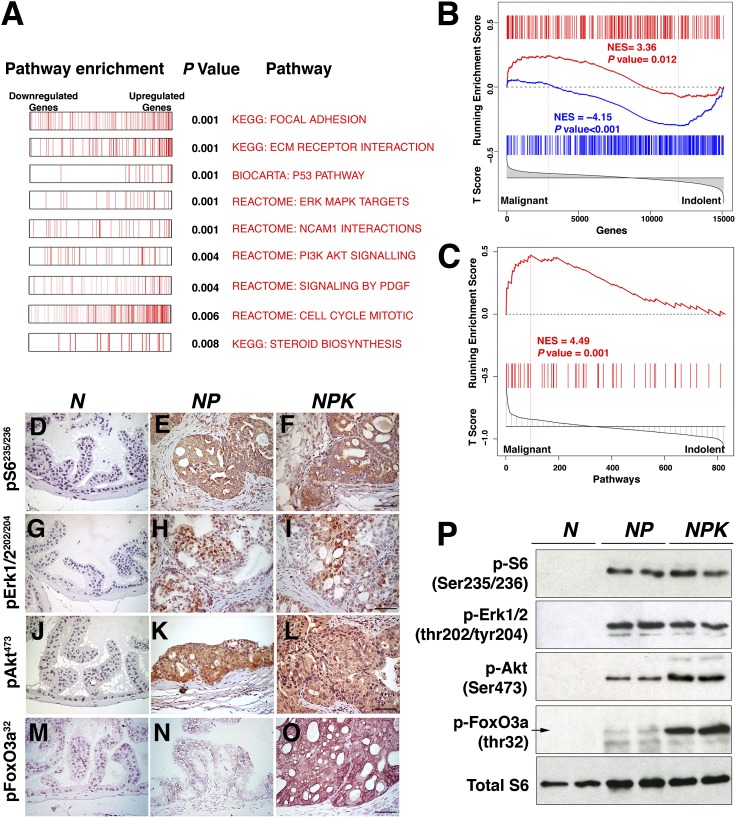
Signaling pathway activation in NPK mouse prostate tumors. (A) Pathway enrichment analyses. Summary of GSEA analyses comparing NPK and NP mouse prostate tumors. Shown is a summary of biological pathways indicating the down-regulated and up-regulated genes, with P value of enrichment indicated. (B) Cross-species GSEA analyses showing the enrichment of an expression signature from the NPK vs. NP mouse prostate tumors compared with a reference signature of malignant vs. indolent human prostate cancer. (C) GSEA analyses of biological pathways comparing pathways that are differentially activated in the NPK vs. NP mouse prostate tumors with pathways enriched in a reference signature of malignant vs. indolent human prostate cancer. (D–O) Immunohistochemical staining of mouse prostate tissues using the indicated phosphoantibodies. (Scale bars, 100 μm.) (P) Western blot analyses using total protein extracts prepared from dorsal prostate or prostate tumors from the indicated mouse genotypes. Additional supporting data are provided in SI Appendix, Figs. S2 and S3 and Datasets S1–S3.

